

Although quite a few altcoins showed a price drop yesterday, not much has changed for Bitcoin. In fact, my expectation has only become more bullish, with a very clear signal on the hourly chart pointing to an upcoming price breakout towards $122,000.
The Crypto Report Card
The Crypto Report Card has dropped to a 5. This has everything to do with yesterday evening's sudden 'dip', which caused the Bitcoin daily chart to end with a red candle and almost all altcoins to drop significantly in price. The cause? Mainly profit-taking on altcoins, which have risen sharply in price recently. Especially ETH, XRP, ADA, and SOL took a hit yesterday, with price drops sometimes exceeding 5% within a few hours.
By far most larger altcoins look bullish in terms of trend, making it highly likely that prices will rise again in the short term.
The Monthly Volatility
I can (and will) be brief about the monthly volatility: it has remained unchanged since last Monday's All-Time High.
On the Bitcoin monthly chart, the high is currently 17.2% higher than the low. This percentage is the monthly volatility. The average monthly volatility is now 21.7% over the past six months. The range that belongs to the average monthly volatility is $101,300 - $127,800.
The Average Daily Volatility
The average daily volatility has dropped to 3.2%. This brings the expected range for today, based on yesterday's low and high ($117,376 and $120,265), to $116,500 - $121,100.
The daily range is always interesting to keep an eye on. If the price 'breaks out' (down or up) from it, it is often a sign of much higher volatility. Or, as I always say: it can be an exciting day for the Bitcoin price.
The Daily Chart
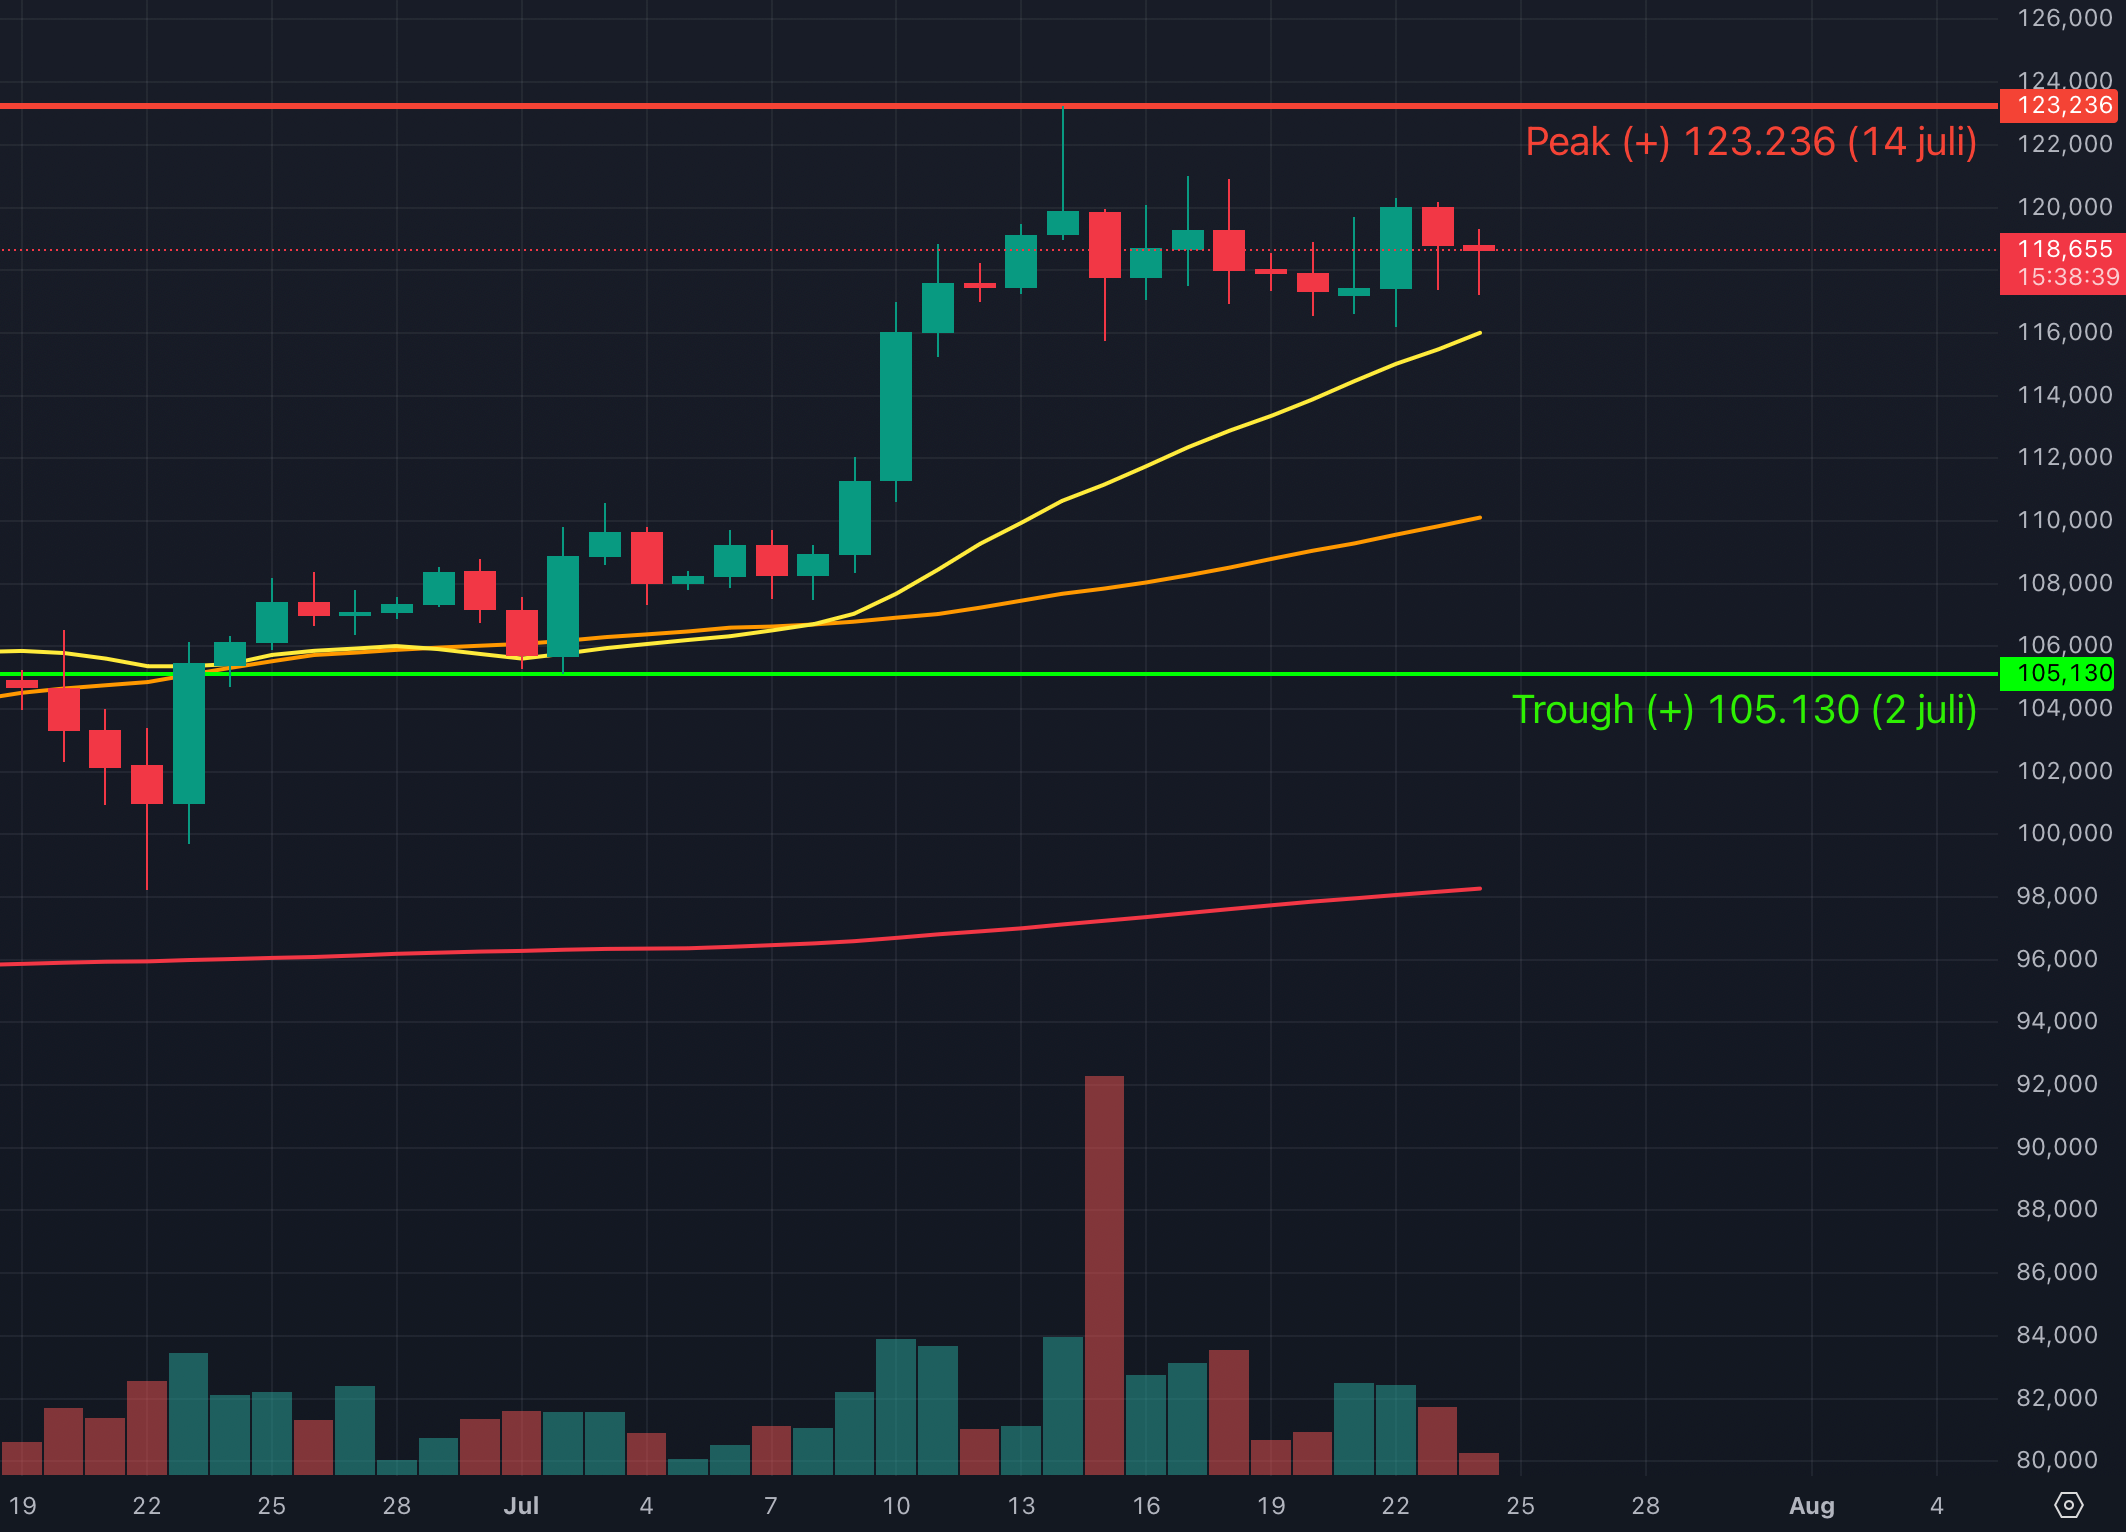
The low of the day before yesterday (the last green candle) has indeed, as was to be expected yesterday, become a new swing low. This means that we technically have a new trough, which at $116,186 is significantly higher than the previous trough from July 2.
The probability of this becoming the new trough is high, as the trend on the daily chart remains stably bullish, which makes the chance of further price increases, and thus a new All-Time High, significant; I do not expect sharp declines at this moment.
The Hourly Chart
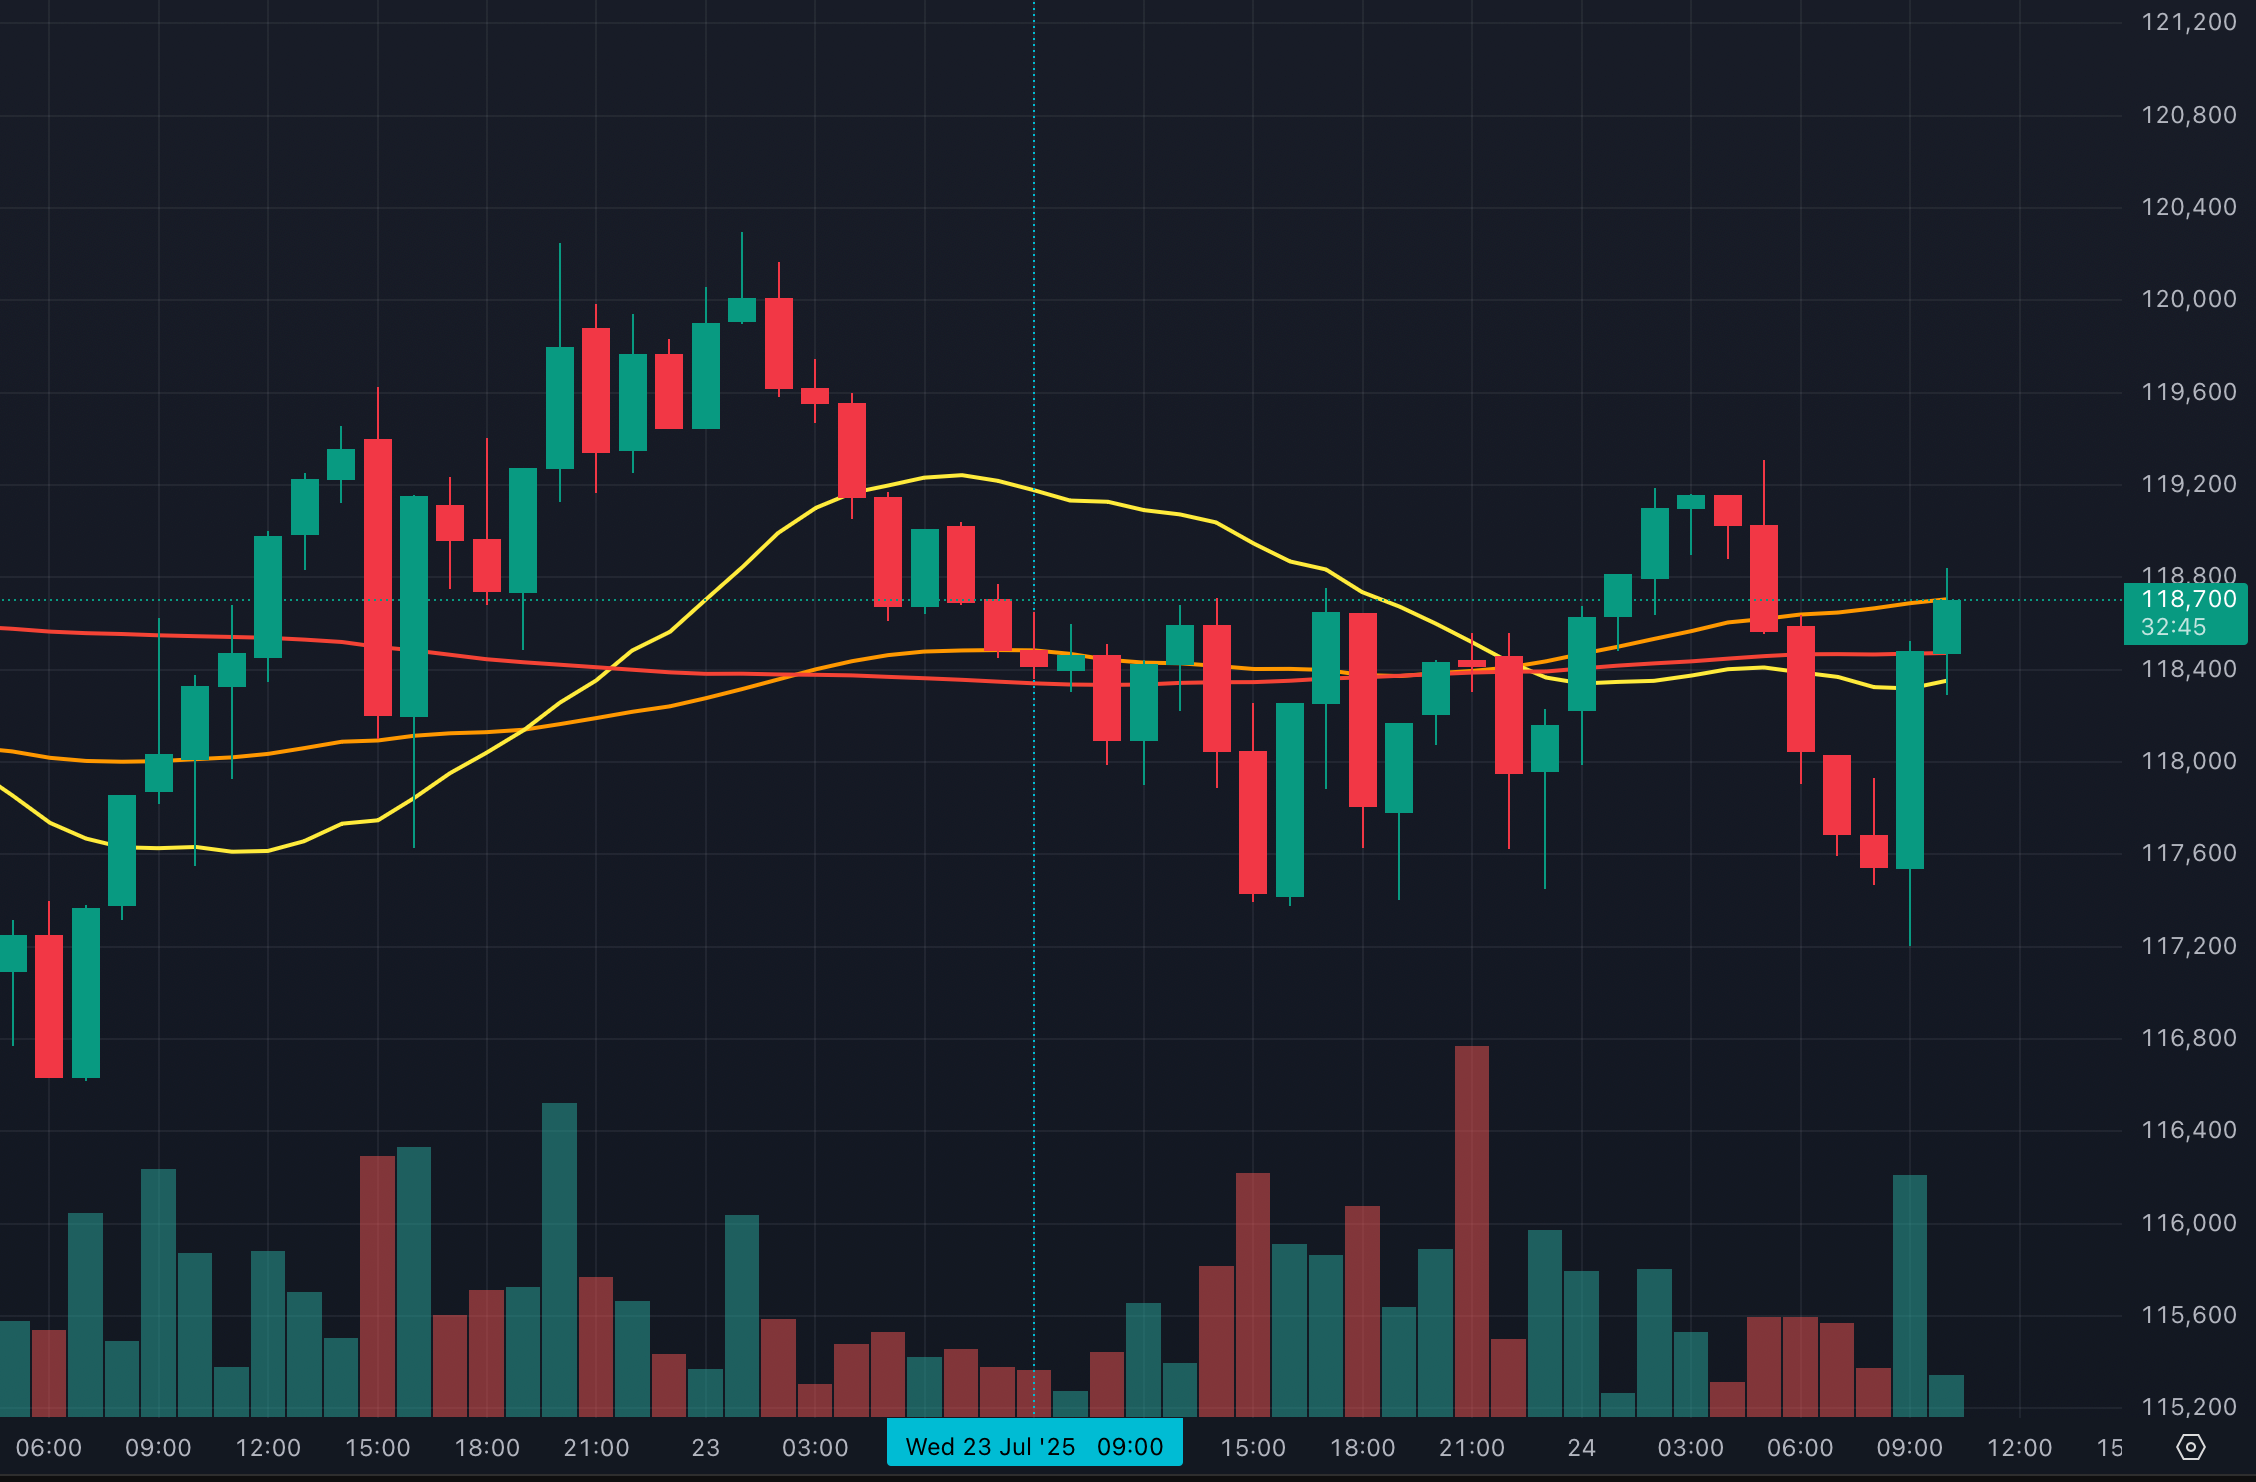
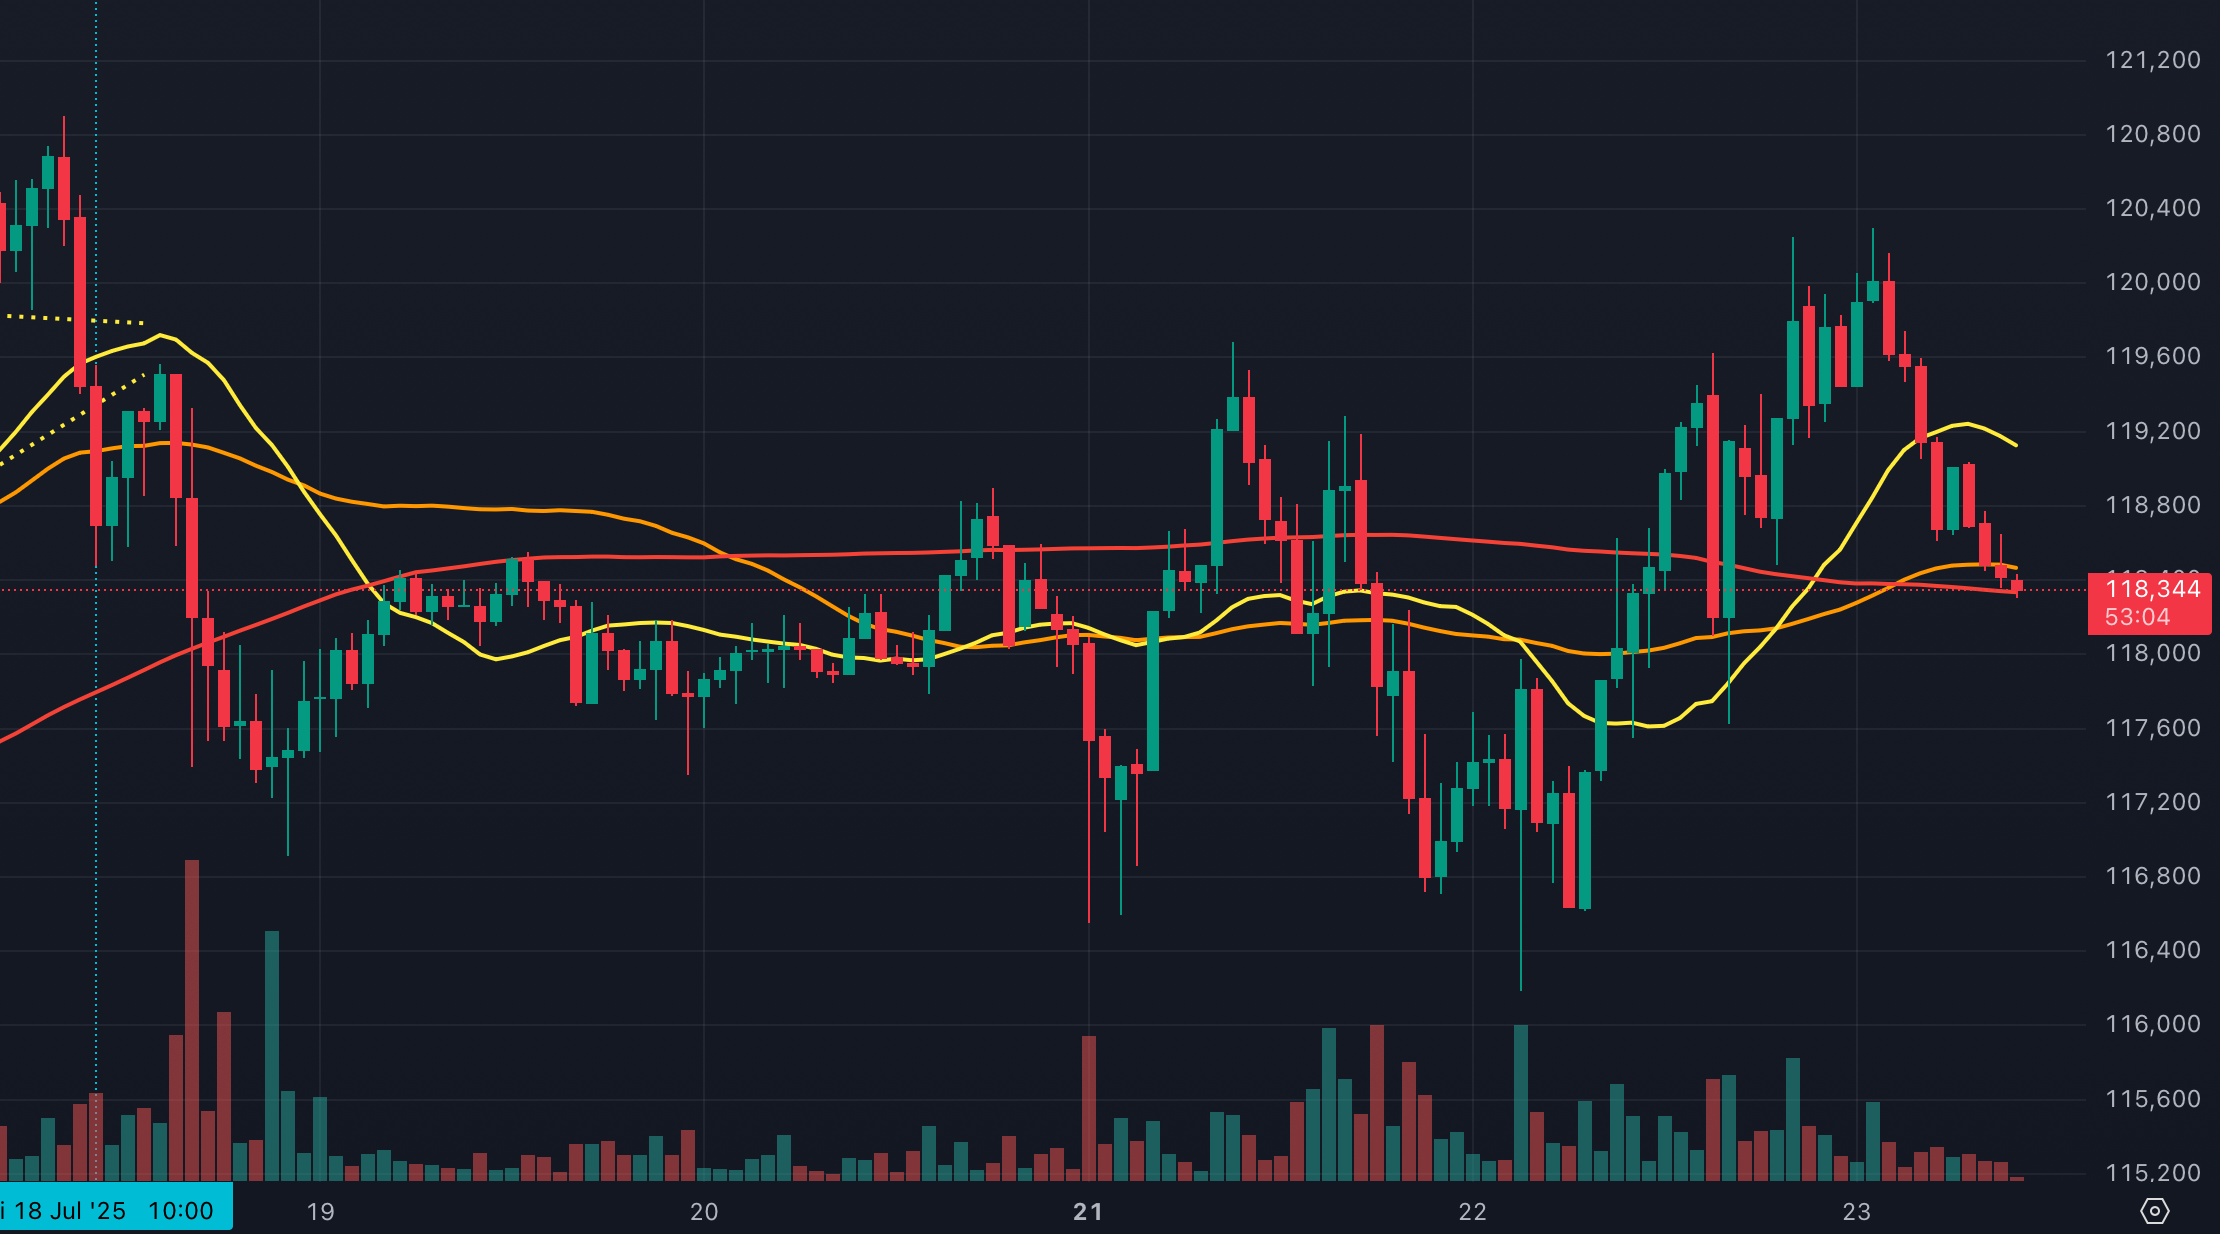
At first glance, the hourly chart does not seem to give a signal: the MA lines are still in the wrong order, and there appears to be a sideways movement within a bullish trend. But there is definitely something to see.
The Falling Wedge Signal
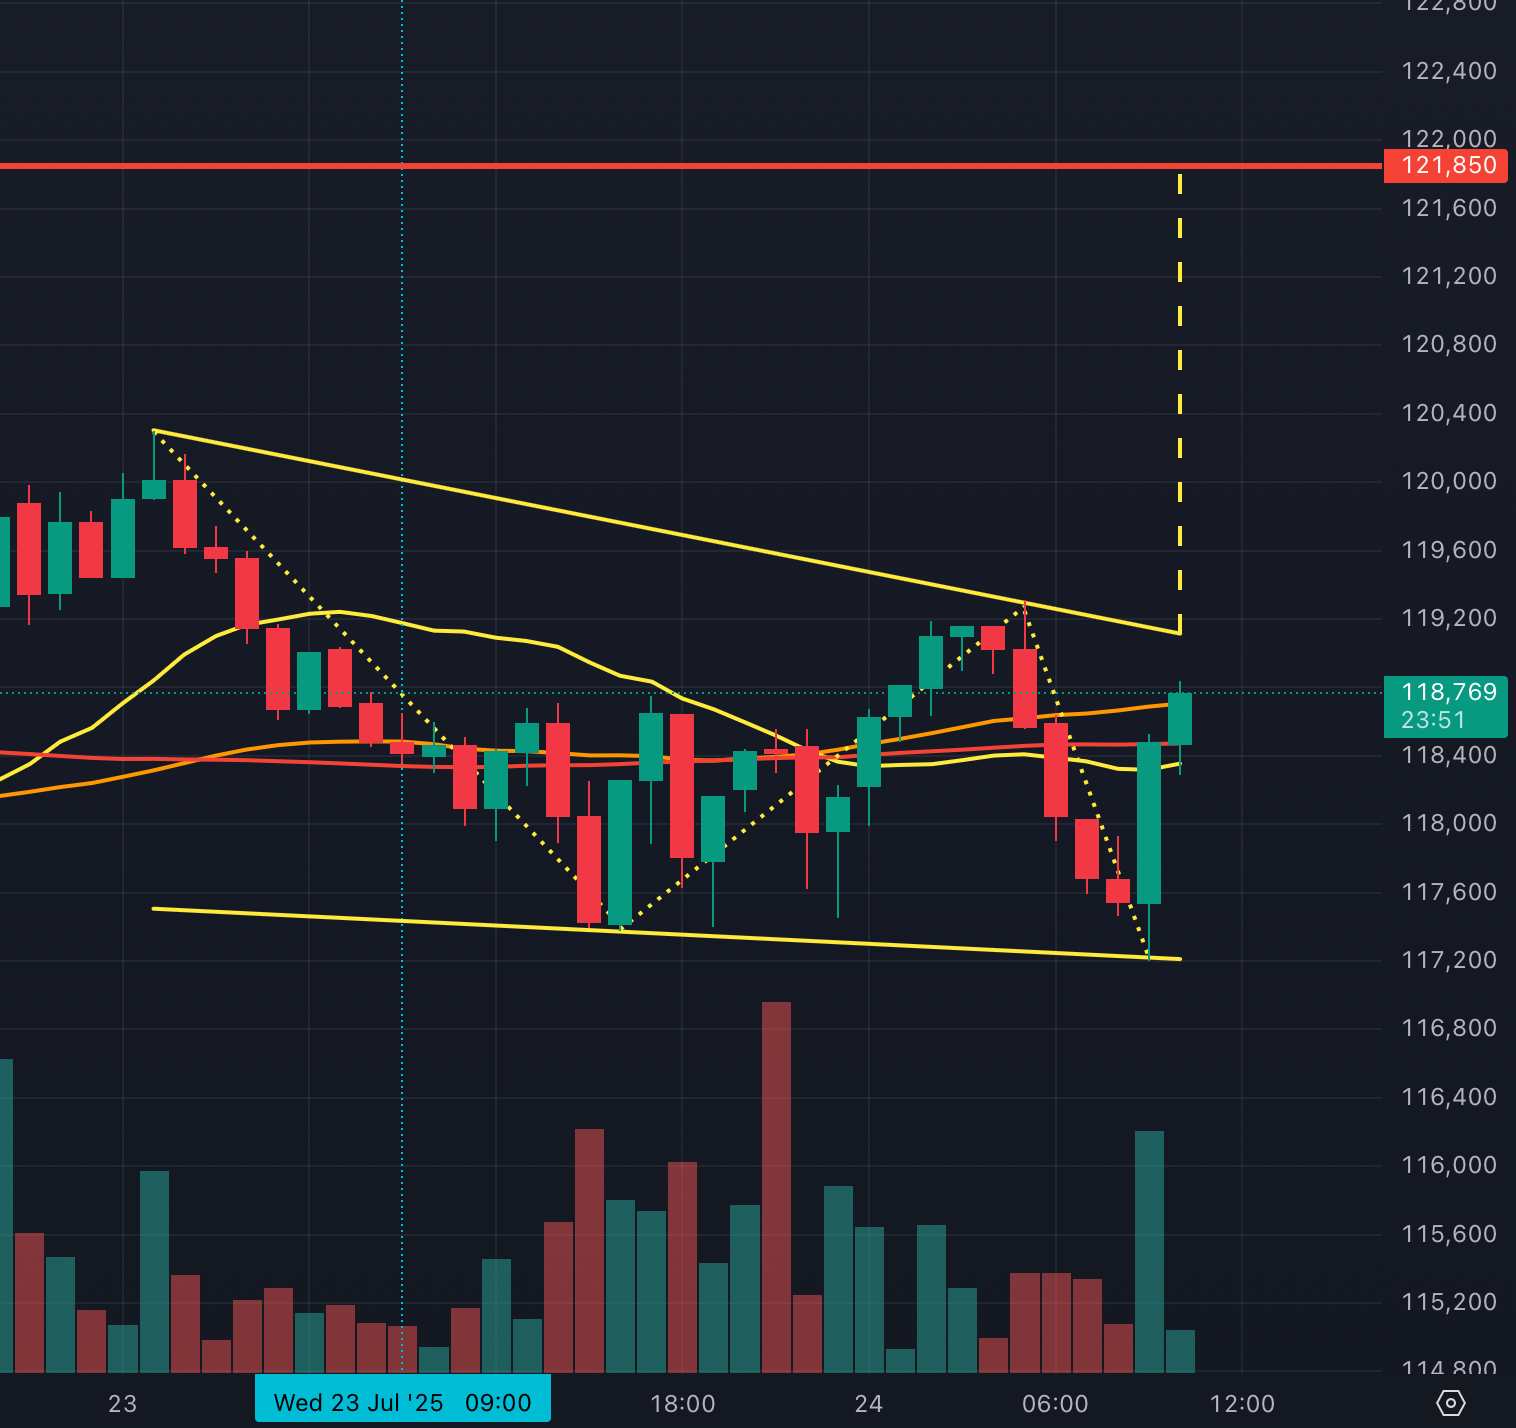
As you can see in the image above, a Falling Wedge has emerged since yesterday's analysis: the last two 'extreme highs' result in a downward sloping line, which also applies to the last two 'extreme lows'. Such a Falling Wedge is a bullish chart pattern that, with a high degree of certainty, indicates an upcoming breakout.
The percentage by which the price can break out is as large as the percentage difference between the lower and upper lines (at the beginning): 2.3%.
The target price (currently $121,850) changes every hour, as long as no breakout has occurred. You calculate this price based on the point where the price 'breaks out'. At the moment, this is the 10 AM candle (European time, by the way).
My Expectation
Since yesterday, nothing has changed regarding my expectation: the chance of a new All-Time High has increased over the last few days. The main reasons are again:
There is still room concerning monthly volatility.
The daily chart is bullish, and the bullish momentum is increasing.
The hourly chart now gives a clear bullish signal with the Falling Wedge.
And so, I am again keeping a close eye on the daily range: $116,500 - $121,100. If we see a price breakout from that range, it will be an exciting day!
Please note: I am NOT giving you financial advice. Everything you read here is my expectation and not a 'prediction' or anything similar. You will never receive a tip from me, not even 'between the lines', to buy or sell anything.
The only and best advice I can give you is: always do your own research – preferably always in the same way – before deciding to buy or sell an 'asset' such as Bitcoin.
The modest price drops I expected in my previous analysis have indeed occurred. But that's as far as it went: the bullish trend on the daily chart now seems to be confirmed by what we are seeing on the hourly chart. The sentiment has also become much more positive. Time for another All-Time High?
The Crypto Report Card
The Crypto Report Card has risen to an 8. The cause? Altcoins! The trend for many altcoins has now reversed and become convincingly bullish. And while there is absolutely no talk of an altcoin season yet (that really requires more than two weeks of price increases), the enthusiasm for altcoins has returned among retail traders and investors.
The Monthly Volatility
The monthly volatility has been unchanged for over a week now, since last Monday's All-Time High. Statistically, we could still see breakouts this month towards $128,000 or, in case of extremely bearish news, towards $101,000.
On the Bitcoin monthly chart, the high is currently 17.2% higher than the low. That percentage is the monthly volatility. The average monthly volatility is now 21.7% over the past six months. The range that corresponds to the average monthly volatility is $101,300 - $127,800.
The Average Daily Volatility
The average daily volatility is 4.6%, likely for the last time today. This volatility will probably dip tomorrow (because the low of June 22nd will no longer be included in the calculation). But based on yesterday's low and high ($116,186 and $120,297), the expected range for today is $115,000 - $121,500.
The Daily Chart
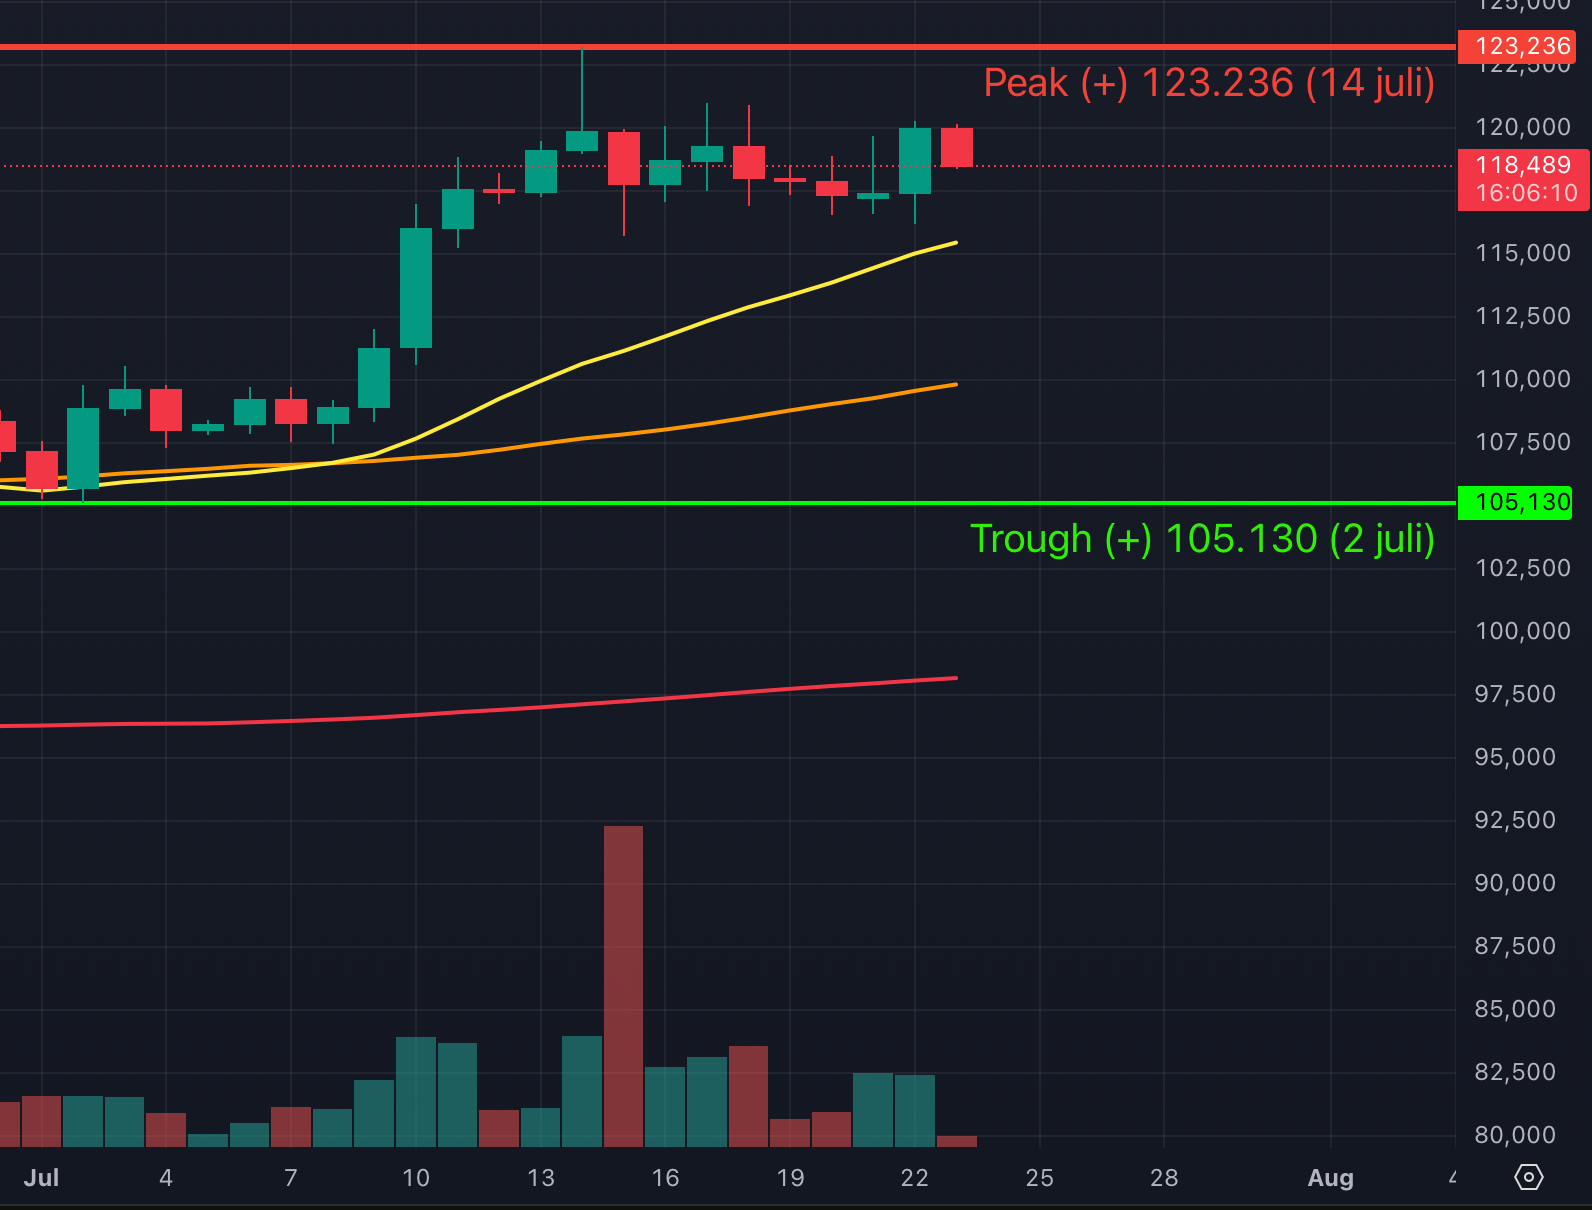
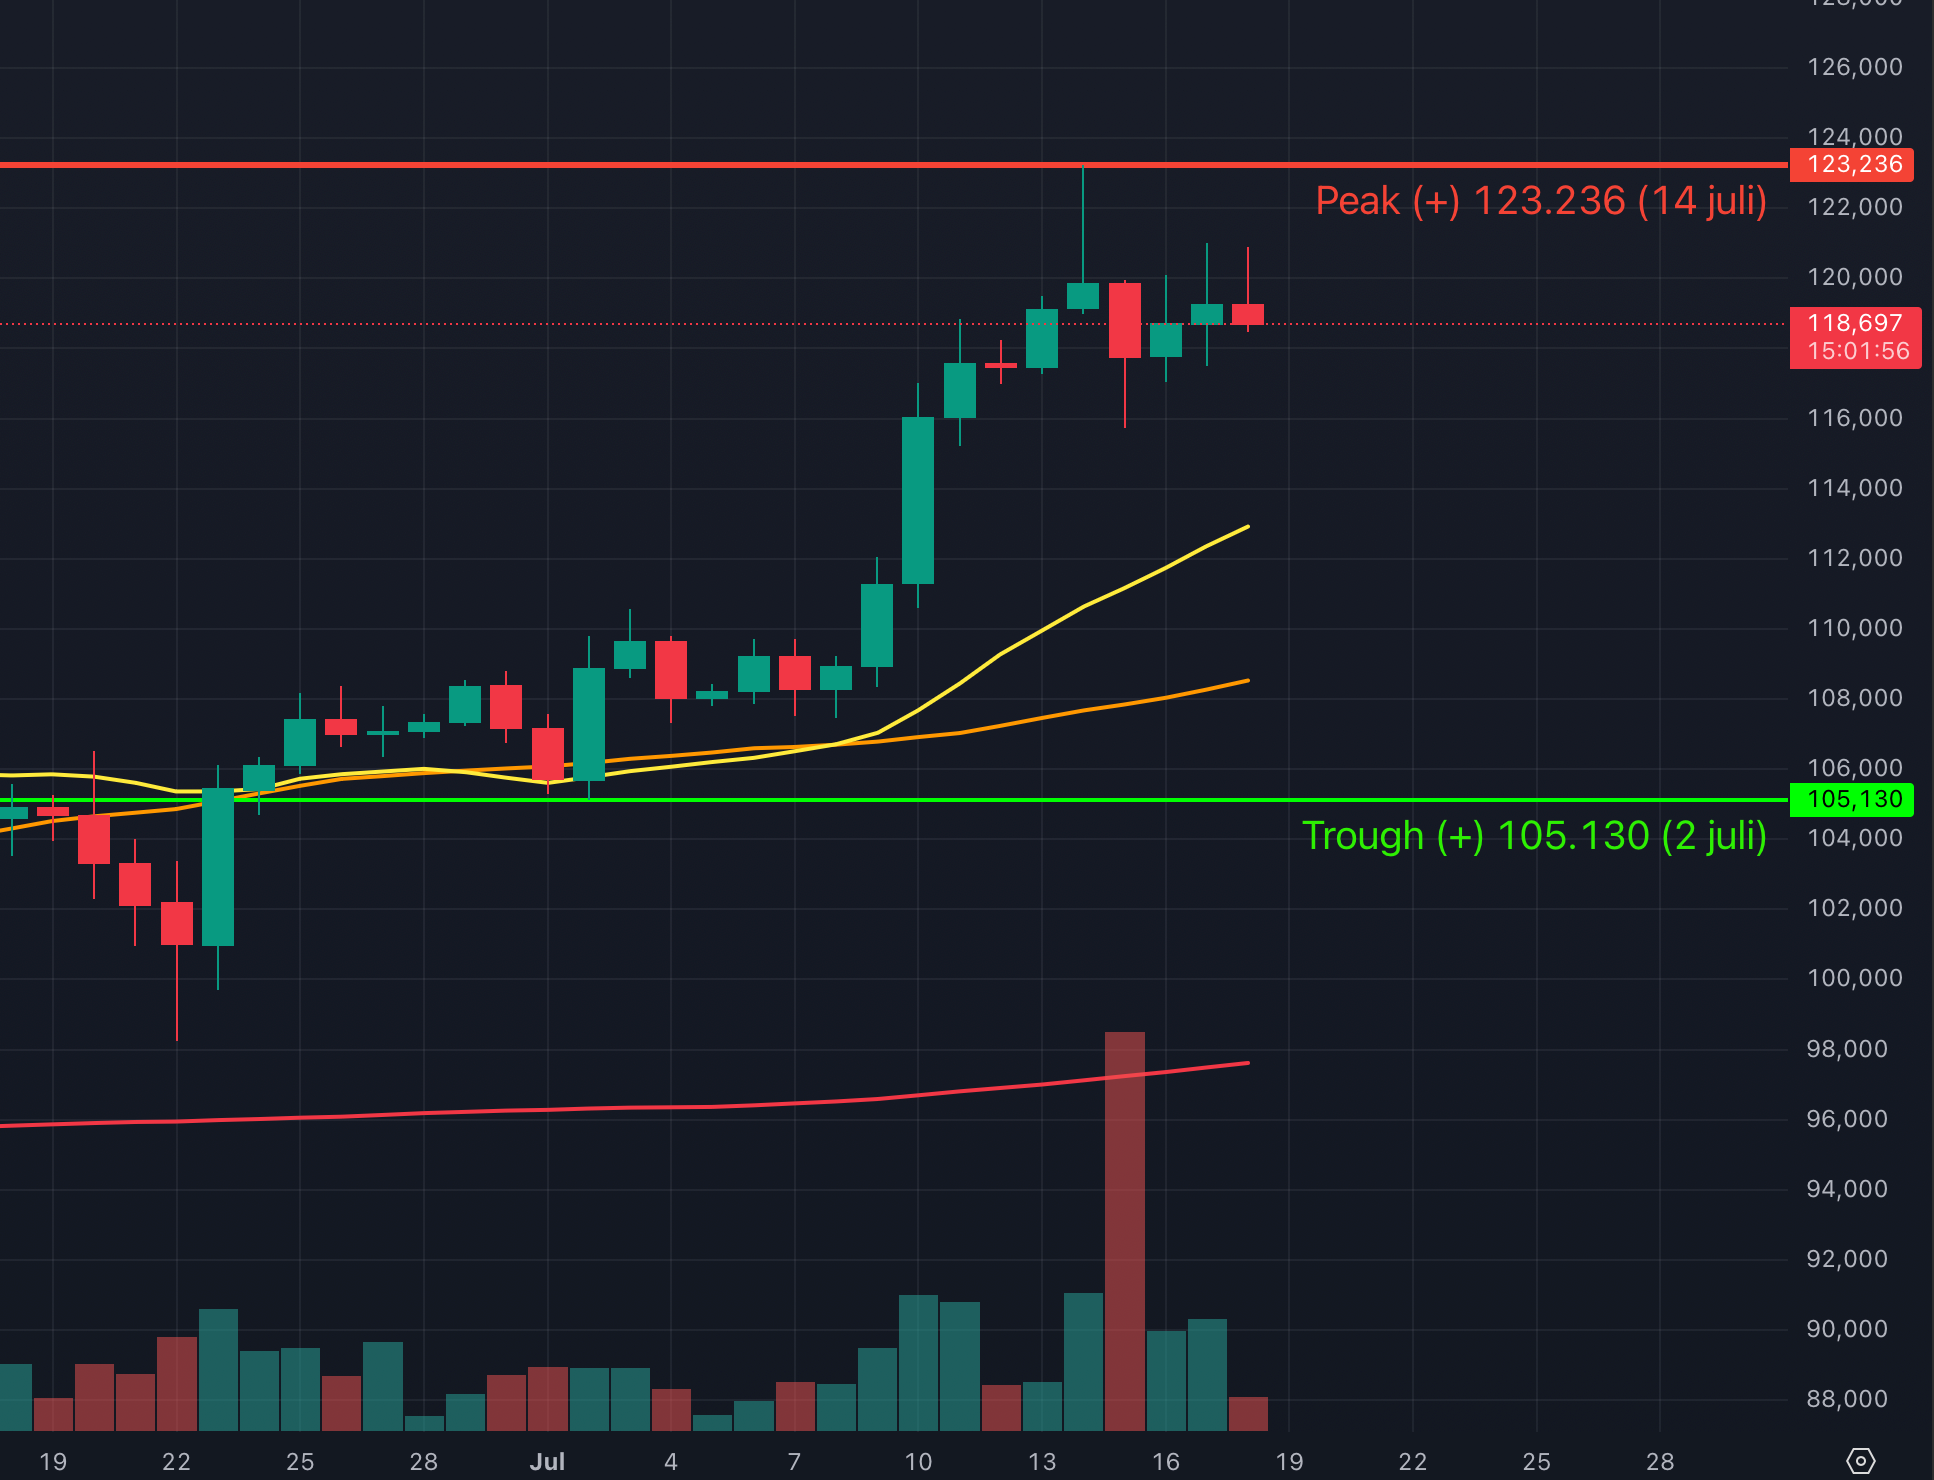
The trend on the Bitcoin daily chart is still stably bullish. Technically, with yesterday's low ($116,186), we may have caught a new swing low (and thus a new bottom). If that indeed turns out to be the case tomorrow, it would be a textbook continuation of the bullish trend, with ever-higher highs and higher lows.
The signal of declining momentum I mentioned in my previous analysis did materialize: there was too little momentum last week to reach a new All-Time High. However, that changed a bit yesterday: the body of the green candle is finally significantly larger than its wicks again. In this bullish trend, this increases the probability of higher prices – and thus the chance of a new All-Time High!
The Hourly Chart
The hourly chart is quite erratic at the moment: since my last analysis (the vertical blue dotted line indicates the time), the trend has reversed more than ten times. What's noticeable is that the bullish trends have more momentum than the bearish trends. You could therefore see the bullish trends as 'stronger': in any case, the hourly chart does not give a clear signal that the bullish trend on the daily chart is about to reverse.
However, the 1h-chart is not stably bullish: although the three MA lines are in the correct order, that's all there is to it. For a stably bullish chart, you want to see the price above the MA lines, with those MA lines, from top to bottom—fast, slower, slowest—all pointing upwards. That has not been the case since my last analysis (the blue vertical dotted line).
My Expectation
The chance of a new All-Time High has increased in the last few days:
There is still room regarding monthly volatility.
The daily chart is bullish and bullish momentum is increasing.
The hourly chart does not show a clear diverging signal.
I am keeping a close eye on the daily range in particular: $115,000 - $121,500. If the price breaks above that $121,500, things will get interesting today!
Please note: I am NOT giving you financial advice. The only thing you are reading here is my expectation and not a 'prediction' or anything of the sort. You will never get a tip from me, not even 'between the lines', to buy or sell anything.
The only and best advice I can give you is: always do your own research – preferably always in the same way – before you decide to buy or sell an asset like Bitcoin.
Although the market reacted enthusiastically to positive economic news from the United States and the price even briefly touched $121,000 yesterday, that's where it stayed. Meanwhile, trading volume, and with it momentum, is decreasing. What do the charts tell us about Bitcoin's price development this weekend?
The Crypto Report Card
The Crypto Report Card remains unchanged at a 6. Sentiment therefore remains hesitant, despite significant price increases for a few altcoins over the past 24 hours. While some altcoin markets are already showing upward trends, there are still too few for a stably higher Report Card.
The Monthly Volatility
The monthly volatility is unchanged compared to yesterday. In fact, it hasn't changed since the previous All-Time High, which was last Monday.
On the Bitcoin monthly chart, the high is currently 17.2% higher than the low. That percentage is the monthly volatility. The average monthly volatility is now 21.7% over the past six months. The range that belongs to the average monthly volatility is $101,300 - $127,800.
The Average Daily Volatility
The average daily volatility is also still 4.6%. Based on yesterday's low and high ($117,506 and $121,000), the expected range for today is $115,700 - $123,900.
At the time of writing (eleven o'clock in the morning), the Bitcoin price is, like yesterday, somewhere in the middle of that range. And just like yesterday, this range can give a signal: it could be an interesting day for Bitcoin if the price breaks out of the $115,700 - $123,900 range.
The Daily Chart
Although yesterday's high ($121,000) is higher than the day before yesterday, nothing else has changed on the daily chart. The trend remains stably bullish. However, the daily volume is something to keep an eye on: it seems to be decreasing somewhat, which increases the chance of price declines.
As for price action: the longer wicks we've seen over the past two days show some uncertainty about the direction the price should move. Although much indicates that we have not yet reached the new peak (and thus a new All-Time High), there is currently too little momentum for that to happen.
The Hourly Chart
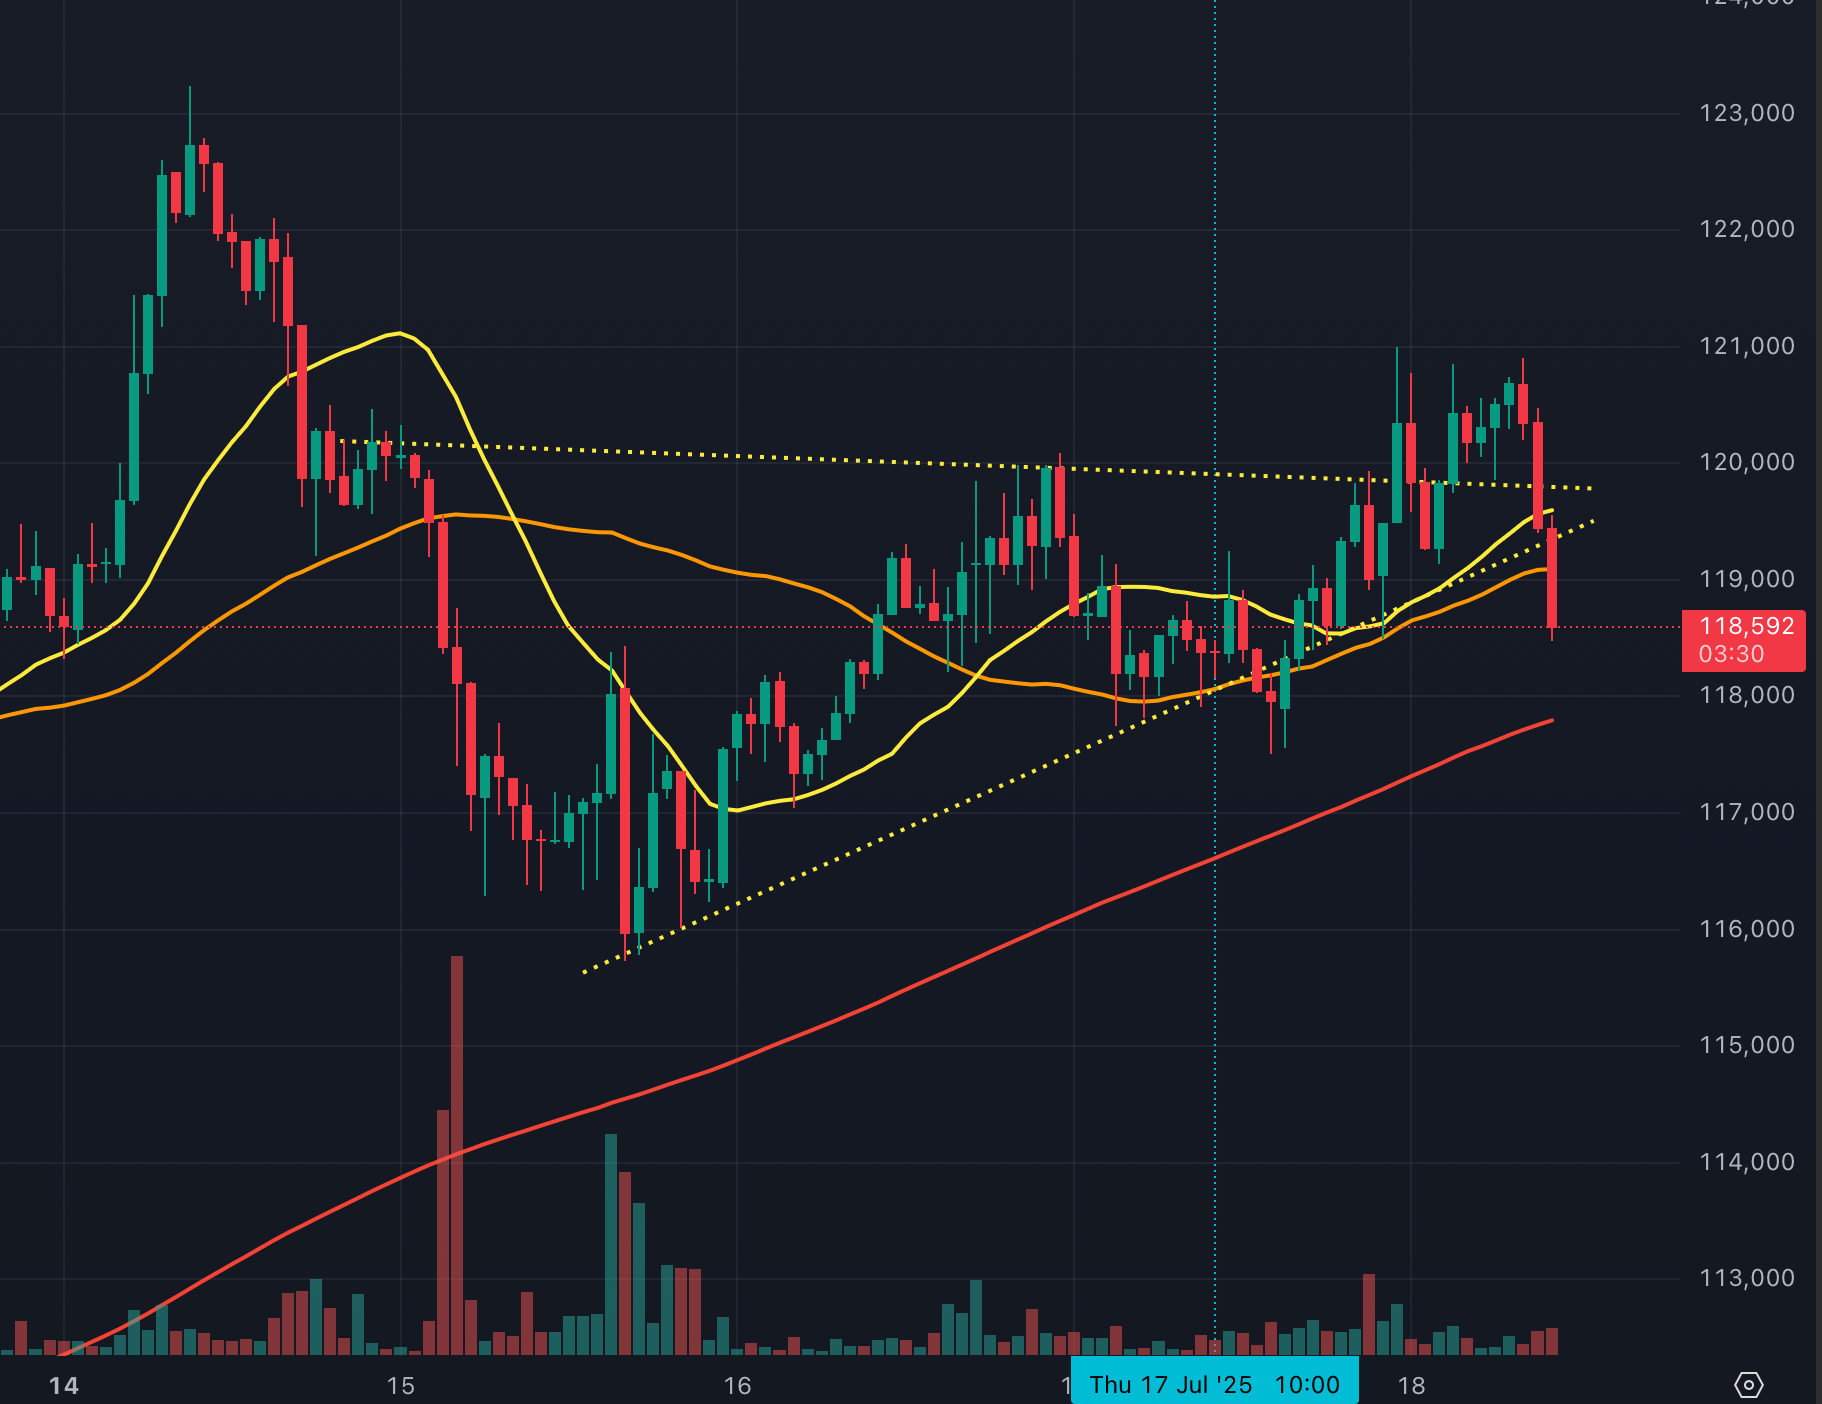
Yesterday's bearish trend reversal indeed turned out not to be very strong; the hourly chart has now turned bullish. The higher peaks and troughs we've seen since yesterday are supported by three MA lines that are all in the correct order and all pointing upwards.
Yesterday afternoon at three o'clock (European Time), shortly after the positive news about employment figures, among other things, was released in the US, the Bitcoin price quickly rose to $121,000. However, the party was already over there: many traders are currently taking profits in the $121,000 zone, which prevented a real breakout, and thus an All-Time High, yesterday. Currently, the Bitcoin price, on the hourly chart, is moving in a range between $118,500 and $121,000.
Trading volume has decreased somewhat in the last 12 hours, indicating a temporary lack of interest from retail traders. And then that triangle from yesterday, which clearly showed that volatility was decreasing: the price was not moving as much anymore. In almost all cases, a breakout then occurs, usually 'with the trend'.
The price did come out of the triangle, but there was no real breakout. A false signal, then: I no longer consider this triangle relevant.
My Expectation
The price currently seems to be moving sideways, with somewhat decreasing interest. Although the 'slower' charts are all bullish, the trend on the faster charts, such as the 5m-chart, has now turned bearish. I'm keeping a close eye on that: if the trend remains bearish there (and we don't see sideways movements on that 5m-chart), I expect some modest price declines during the first part of the weekend.
Please note: I do NOT give you financial advice. Everything you read here is my expectation and not a 'prediction' or anything similar. You will never get a tip from me, not even 'between the lines', to buy or sell something. The only and best advice I can give you is: always do your own research—preferably always in the same way—before deciding to buy or sell an 'asset' like Bitcoin.


