

Although the price of Bitcoin dropped significantly yesterday, it provided an important signal: there were many buyers available to profit from that falling price.
So, there was no panic yesterday, despite some FUD that was spread. Good news for Bitcoin holders, then!
The Crypto Report Card
The Crypto Report Card, which is a good indicator of sentiment in the crypto market, has risen slightly to a 5. It shows that sentiment, also due to the news about rising inflation in America, has become a bit more cautious again.
Monthly Volatility ('Interval Volatility')
Monthly volatility is unchanged and still stands at 17.2%. That is a few percent lower than the expected monthly volatility for July: 21.7%.
On the Bitcoin monthly chart, the high is currently 17.2% higher than the low. That percentage is the monthly volatility.
The average monthly volatility is now 21.7% over the past six months; this is higher than the volatility we have seen so far in July.
We are only halfway through July, so statistically, the chance of more price movement is high. The range associated with the average monthly volatility is $101,300 - $127,800.
Average Daily Volatility
The average daily volatility is currently 4.6%.
Based on yesterday's low and high ($115,729 and $119,945), the expected range for today is $114,700 - $121,100.
As I write this (8:00am in the morning in Europe), the Bitcoin price is still neatly within the expected range. If the price goes outside that range, for example, by dropping back to less than $114,700, it will be another day, just like yesterday, to keep a close eye on the Bitcoin price!
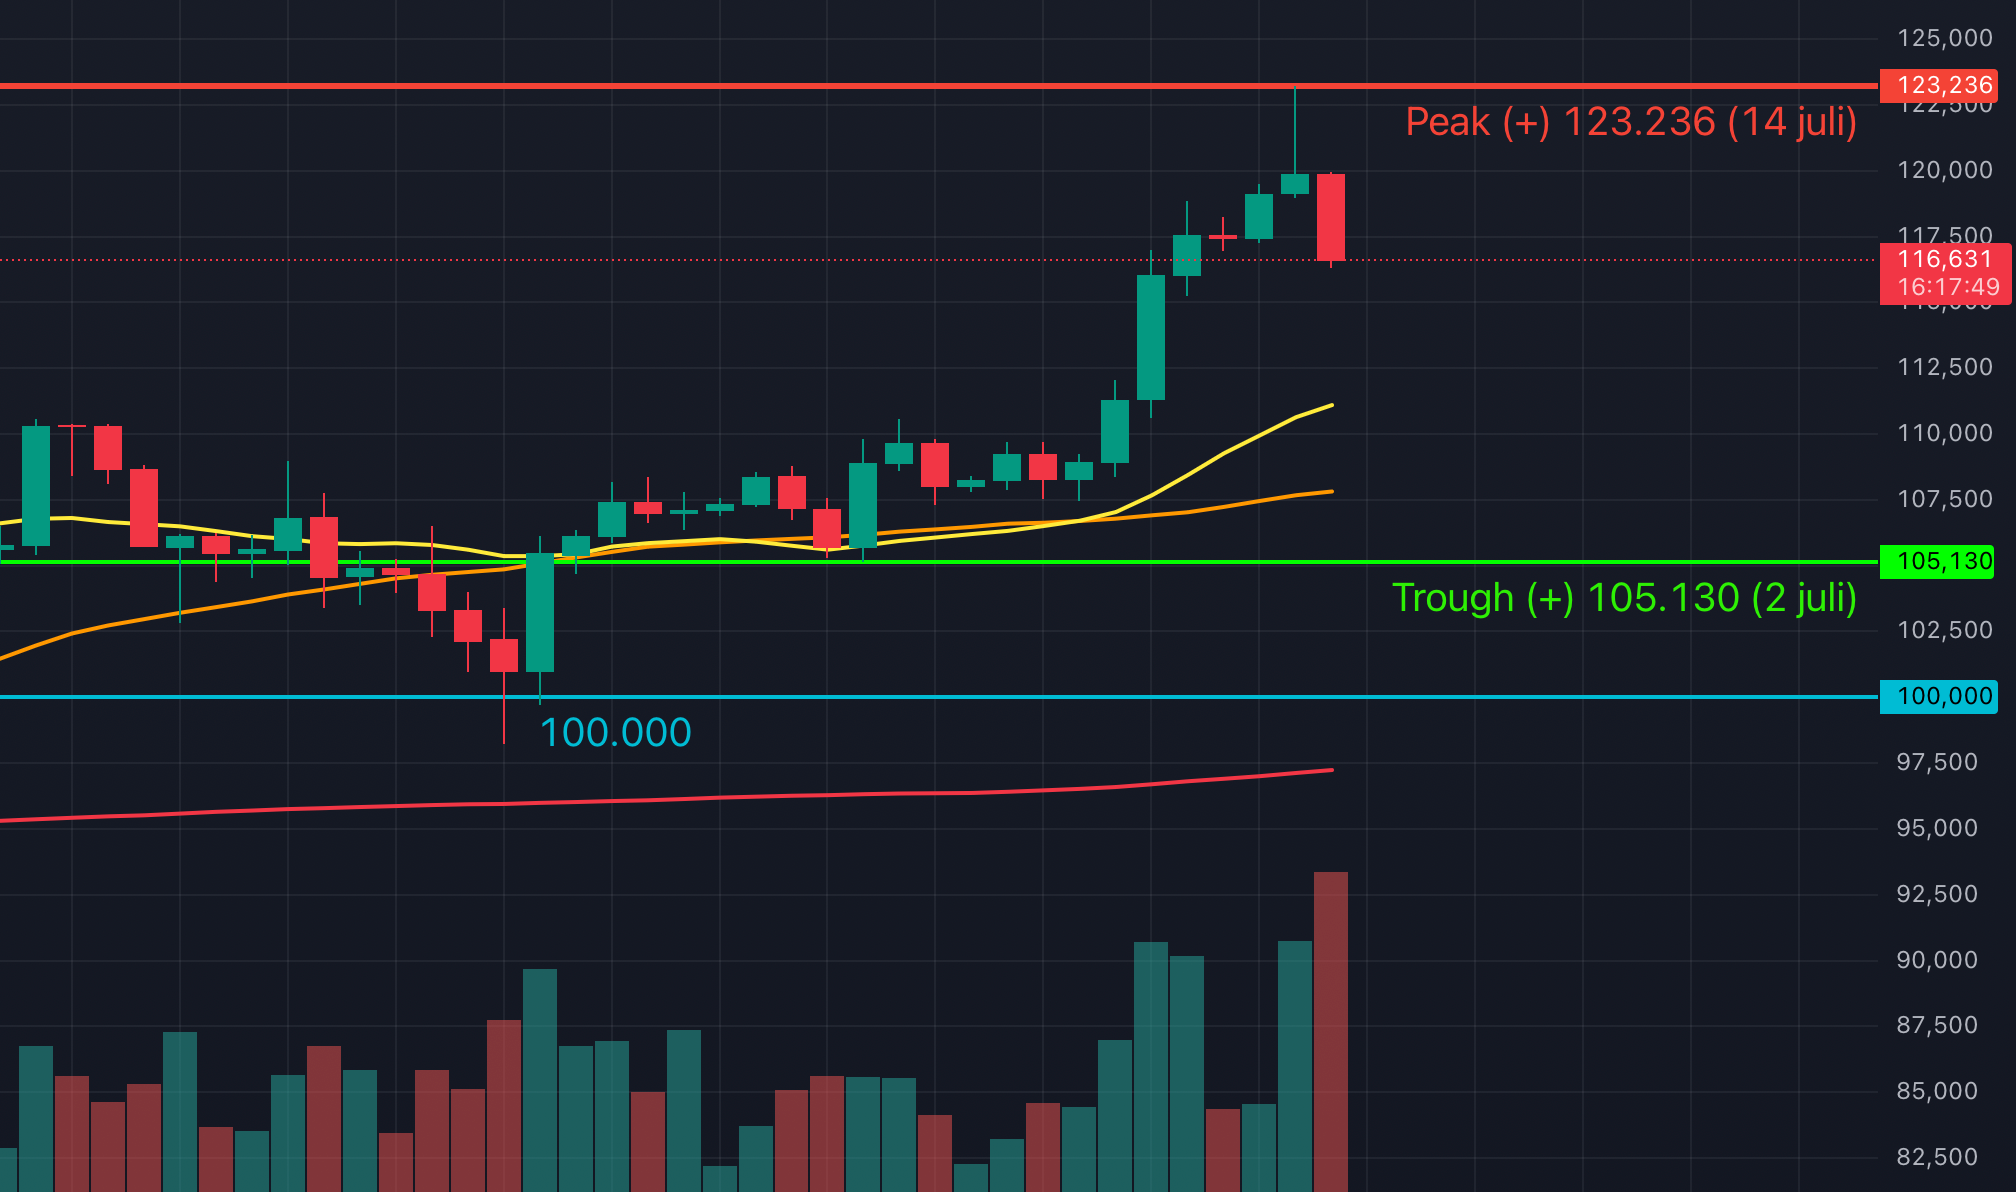
The Daily Chart
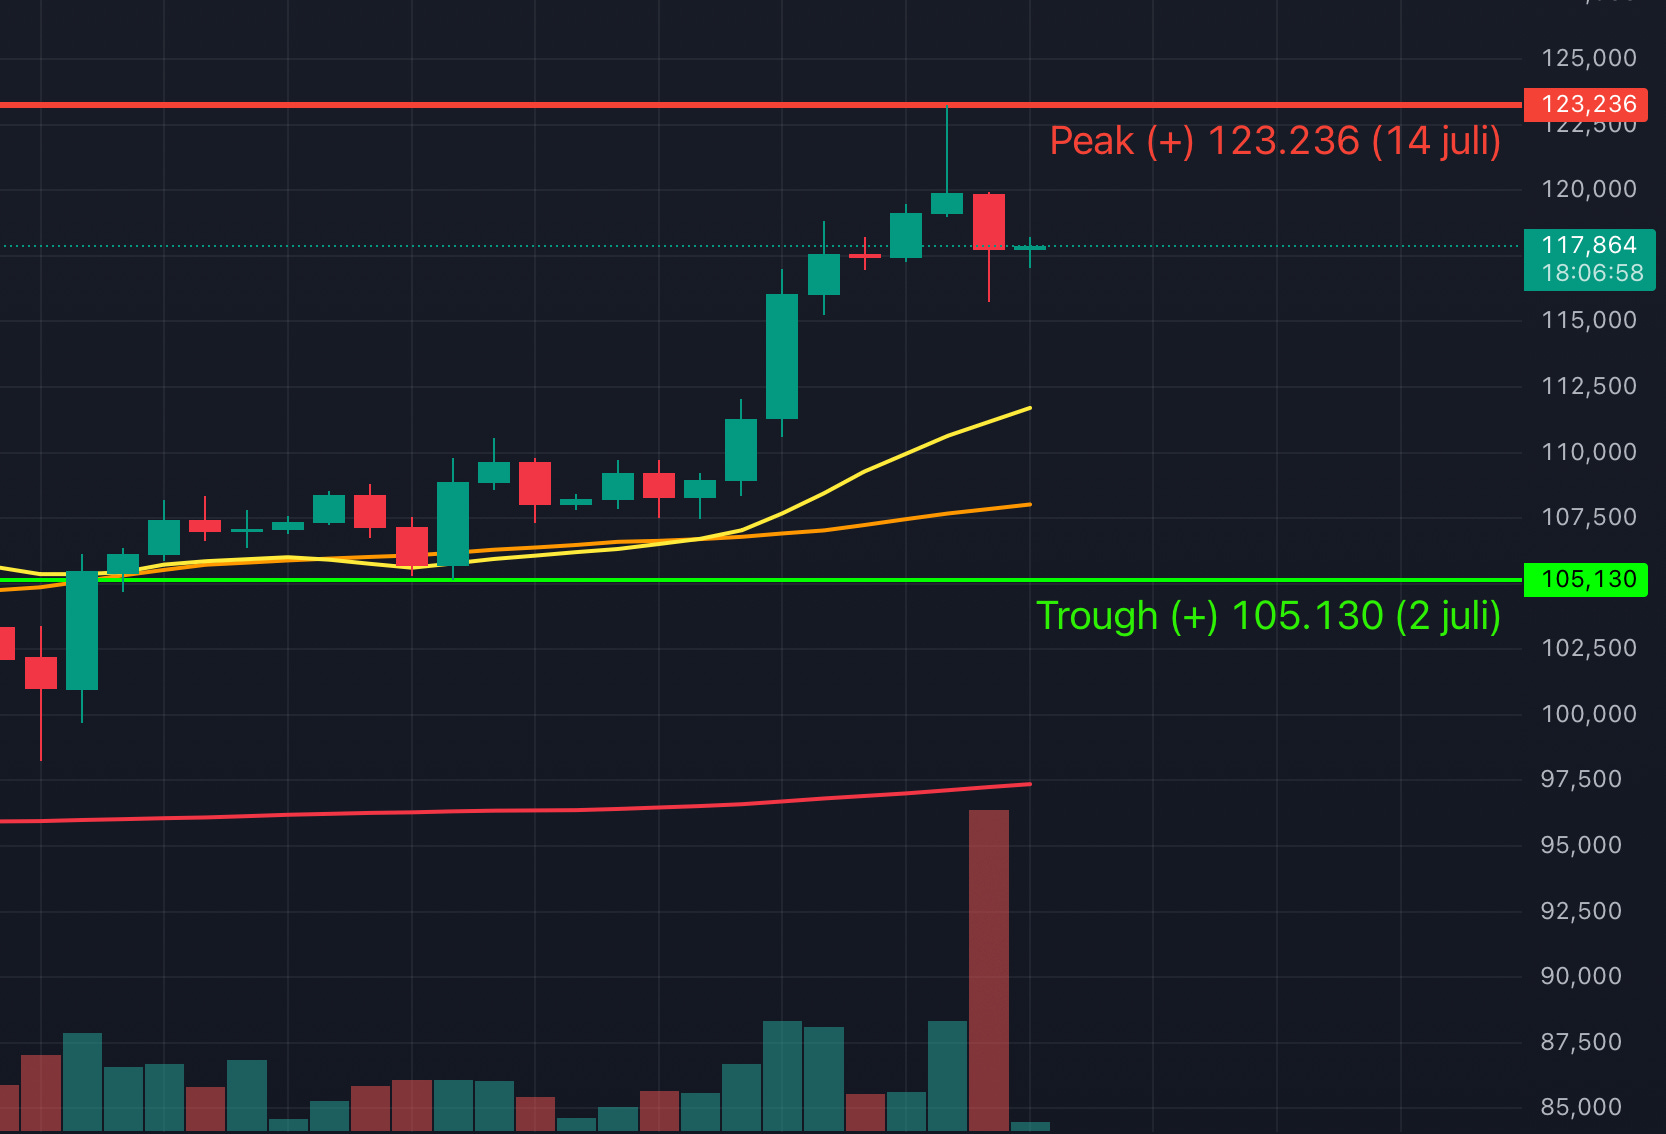
The daily chart shows it very clearly: yesterday's price drop is nothing more than a brief 'pause'. The most important indication of this is yesterday's enormous trading volume.
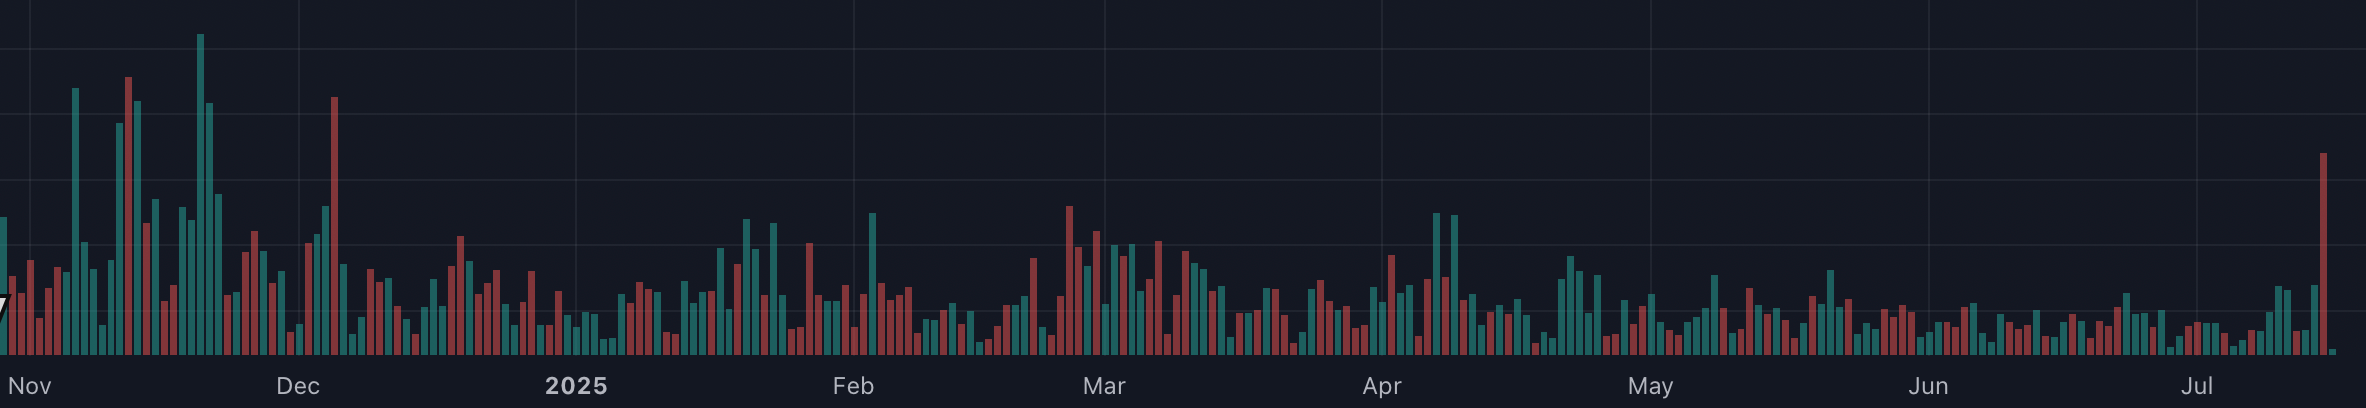
Do you see the red bar, all the way to the right in the image above? That's yesterday's trading volume. The last time we saw so much trading volume in one day was at the beginning of December 2024, more than seven months ago.
Despite this enormous volume yesterday, the price of Bitcoin did not fall spectacularly. This shows that there was no panic whatsoever: there were more than enough buyers for the bitcoins of traders who wanted to take profits.
Nothing has changed in the trend on the daily chart: it remains stably bullish.
And what about the support?
Just like yesterday, it's interesting to look at the Fibonacci Retracement Tool. Will the support hold at $117,400, the first retracement (23.6%)?
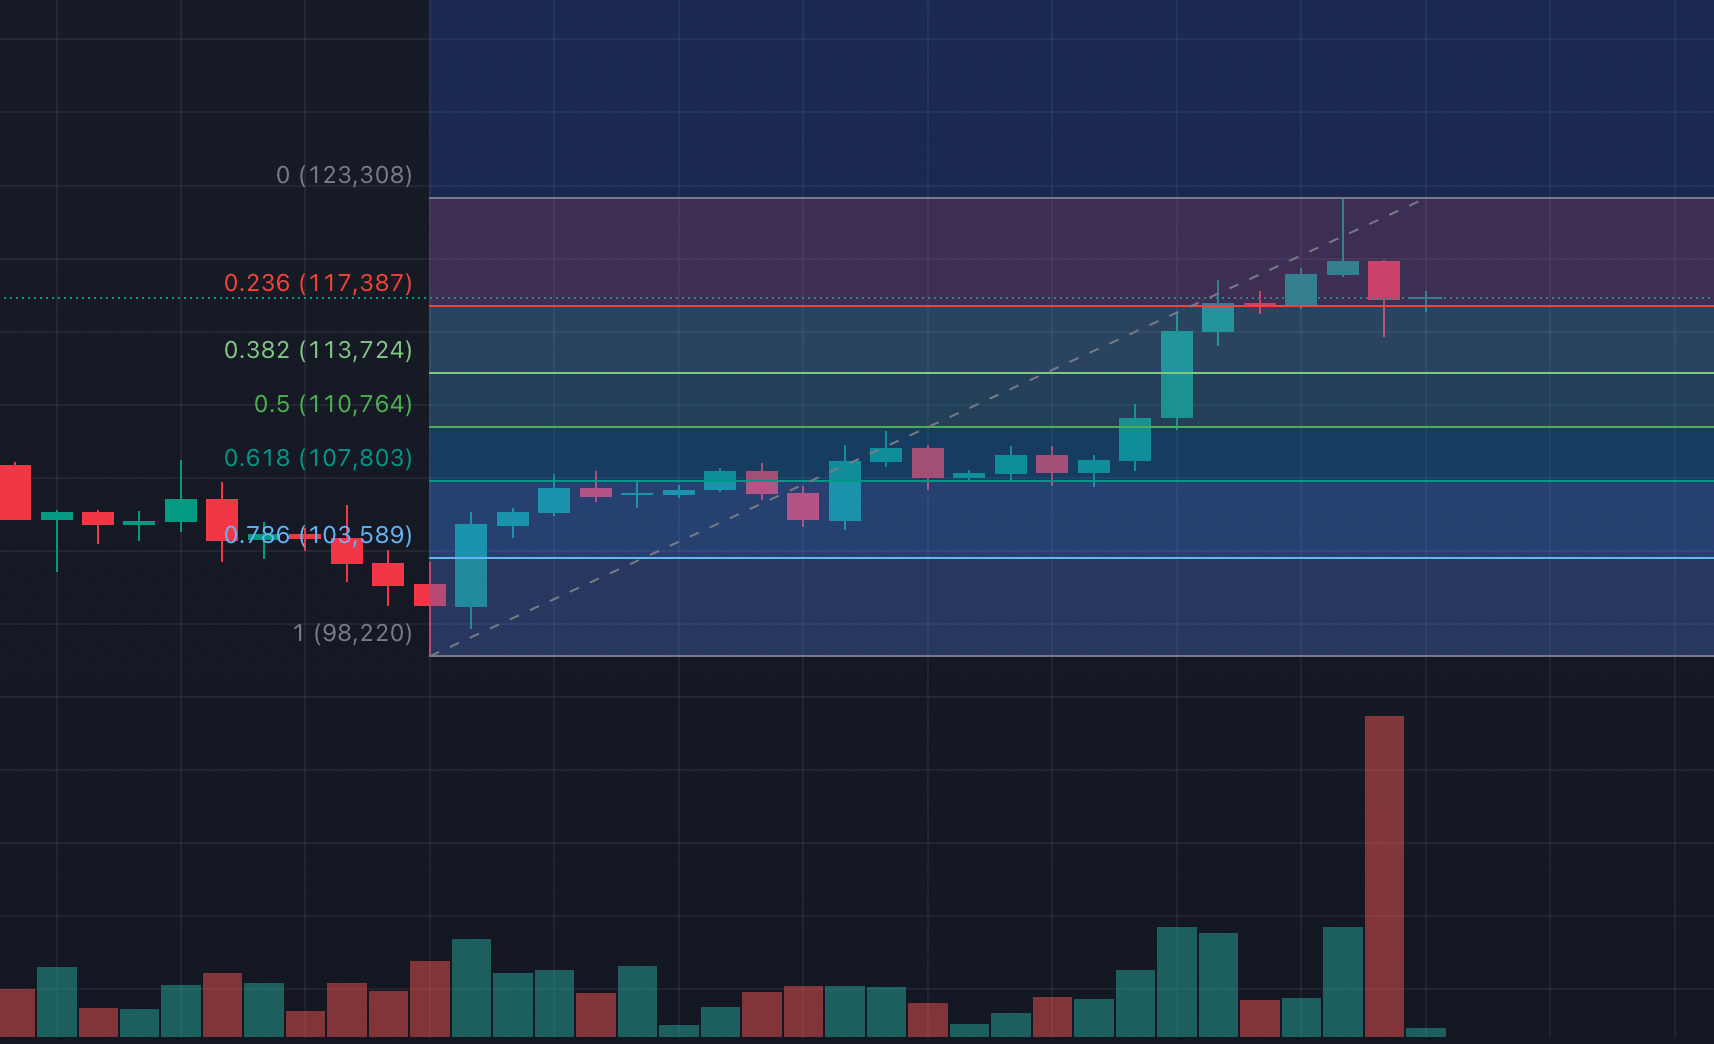
The answer is: yes! That support has been tested again today. And what was already visible yesterday is confirmed today: the 'dip' seems to have been reached.
The long wick on yesterday's candle shows that prices lower than $117,400 have been rejected so far.
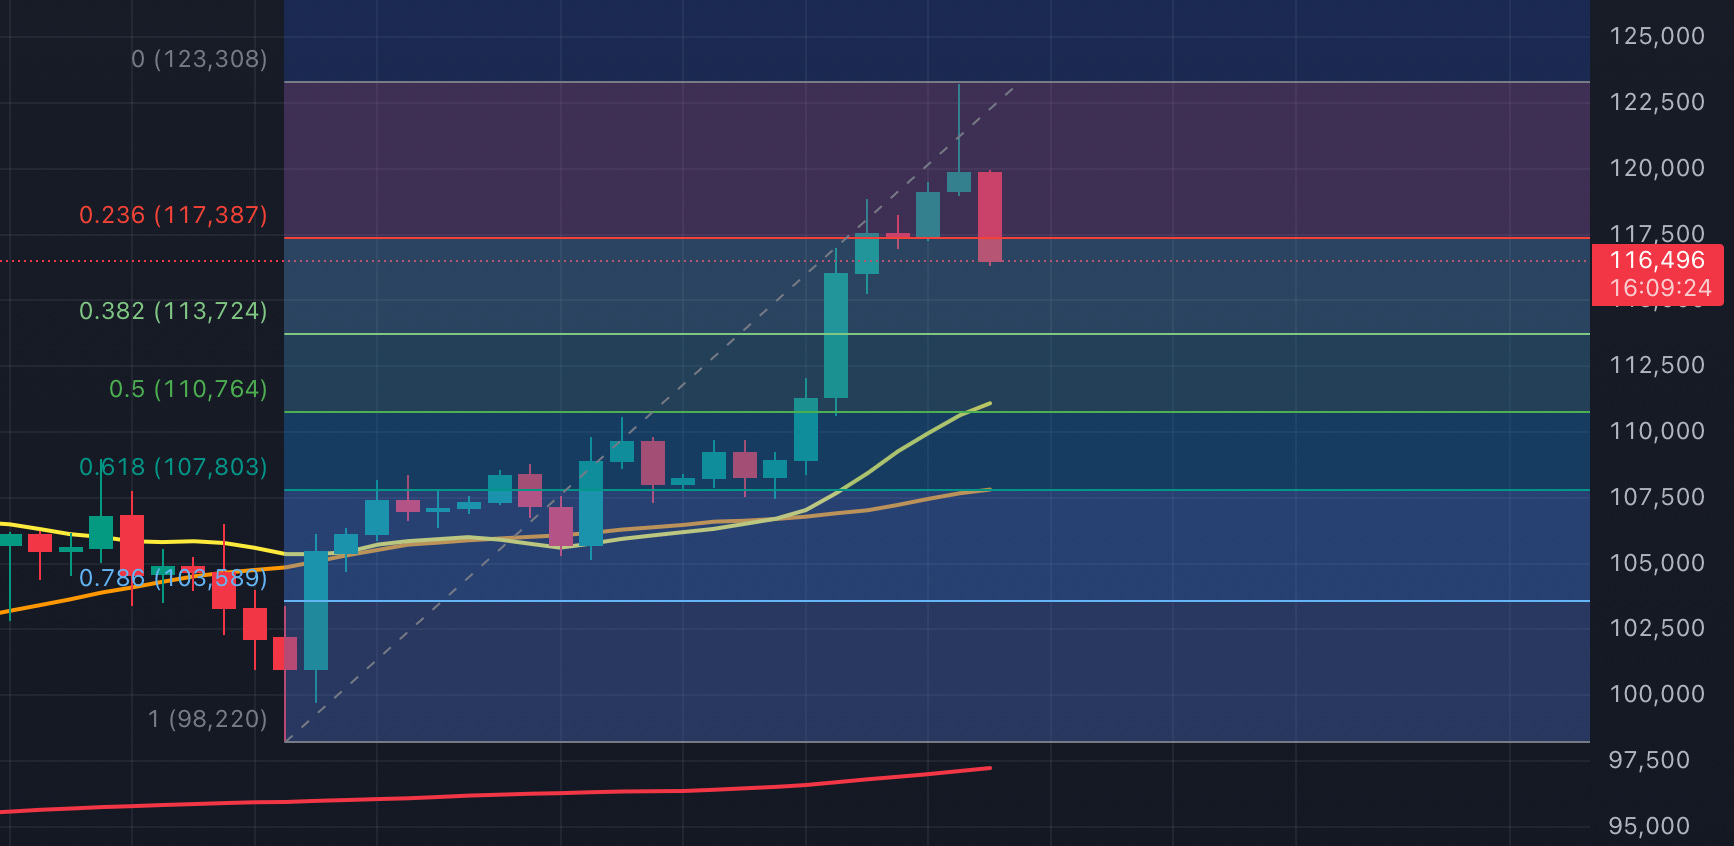
For more certainty, we will have to 'zoom in'. What does the hourly chart tell us about this?
The Hourly Chart
Technically, the hourly chart, as was the case yesterday, is bearish: there is no convincing bullish trend reversal yet (higher highs and higher lows). However, the price has been back above $117,200 for a few hours now: $117,200 is the second retracement (which was tested almost all day yesterday, 38.2%).
In short: if we were to use no other timeframes for our analysis, we’d have to wait a little longer. Based on the hourly chart, it is difficult to conclude whether the dip has been reached or not.
Of course, we could zoom in further, on the even faster 5-minute chart for example. There, the trend is now convincingly bullish, so there is a good chance that the hourly chart will also move in that direction.
My Expectation
Just like yesterday, there are no real alarm signals visible on the charts:
All profit-taking was 'eaten up' by buyers yesterday.
The most important retracement levels seem to be holding.
The heatmap already shows rising prices for many altcoins as well.
Just like yesterday, figures will be released from the US today that shed light on inflation. And so, just like yesterday:
Are those figures negative, which increases the chance of interest rate hikes?
Then a renewed (temporary) falling Bitcoin price is more or less logical.
Are those figures better than expected and does Wall Street react enthusiastically? Then a spontaneous All-Time High is easily possible!
Please note: I am NOT giving you financial advice. All you read here is my expectation and not a 'prediction' or anything of the sort. You will never get a tip from me, not even 'between the lines', to buy or sell something.
The only and best advice I can give you is: always do your own research – preferably always in the same way – before deciding to buy or sell an 'asset' such as Bitcoin.
The expected 'pause' in the Bitcoin price has indeed occurred, with a drop of over 6%. This isn't very surprising: many investors have naturally taken profits. A significant number of Bitcoins are also flowing to exchanges, as a 'large holder' is apparently selling. This, of course, created some FUD. But what is the next step? And what role will Wall Street play in this today?
The Crypto Report Card
The Crypto Report Card has dropped further, to a 3. The (not so special) drop in Bitcoin's price has dragged the altcoins down with it, causing, among other things, a red 'heatmap' on coin360.com. And you can guess that falling altcoin prices aren't exactly good for a potential bullish trend reversal for altcoins.
To keep the Crypto Report Card at a continuous 'sufficient' level, most altcoins need to show a bullish trend on the 'slower' charts. That is absolutely not the case at the moment.
The monthly volatility ('interval volatility')
The monthly volatility is unchanged and still stands at 17.2%. That is a few percent lower than the expected monthly volatility for July: 21.7%.
On the Bitcoin monthly chart, the high is currently 17.2% higher than the low. That percentage is the monthly volatility. The average monthly volatility is now 21.7% over the past six months. This indicates that we can expect more price breakouts this month, with a range of $101,300 - $127,800.
The average daily volatility
The average daily volatility is currently 4.6%. Based on yesterday's low and high ($118,972 and $123,236), the daily range is $117,800 - $124,400.
Just as was the case yesterday, the price has already broken out of that range this morning at half-past nine! This time it's a downward breakout: the price has already been lower than $117,000 at ten o'clock this morning. So there is already more volatility than usual. That means that, just like yesterday, today could be another interesting day for the Bitcoin price.
The daily chart
Yesterday, we discussed what the main causes of a possible price drop would be:
Decreasing trading volume with a rising price
The 'rubber band' effect that occurs when the price is far above its own moving average.
That expected price drop has indeed happened. By the way, this changes absolutely nothing about the trend on the daily chart: it remains stably bullish.
At the moment, the daily chart shows two contradictory signals:
Bullish: the volume has risen rapidly while the price has fallen.
Bearish: the price, even after the drop, is still too far from the MA20.
In the past, the combination of a bullish trend and a bullish volume signal has almost always been stronger than the 'rubber band' signal. In other words: the daily chart points to a possible price increase.
What about the support?
Yesterday, the Fib Retracement Tool told us where the possible support is, in case the price were to fall back.
You can see that the price has now broken through the first retracement line (23.6%). If the price also reaches the next line ($113,700), the peak we saw yesterday is 'valid' and we are technically on our way to a new low. From that moment on, I won't be counting on new All-Time Highs for a while.
How likely is it that the price will fall further, towards that $113,700? Looking at the already high trading volume for today (already 25% higher than yesterday and the day has yet to begin), I wouldn't be surprised if we have more or less reached the 'dip'. But... what does the hourly chart tell us?
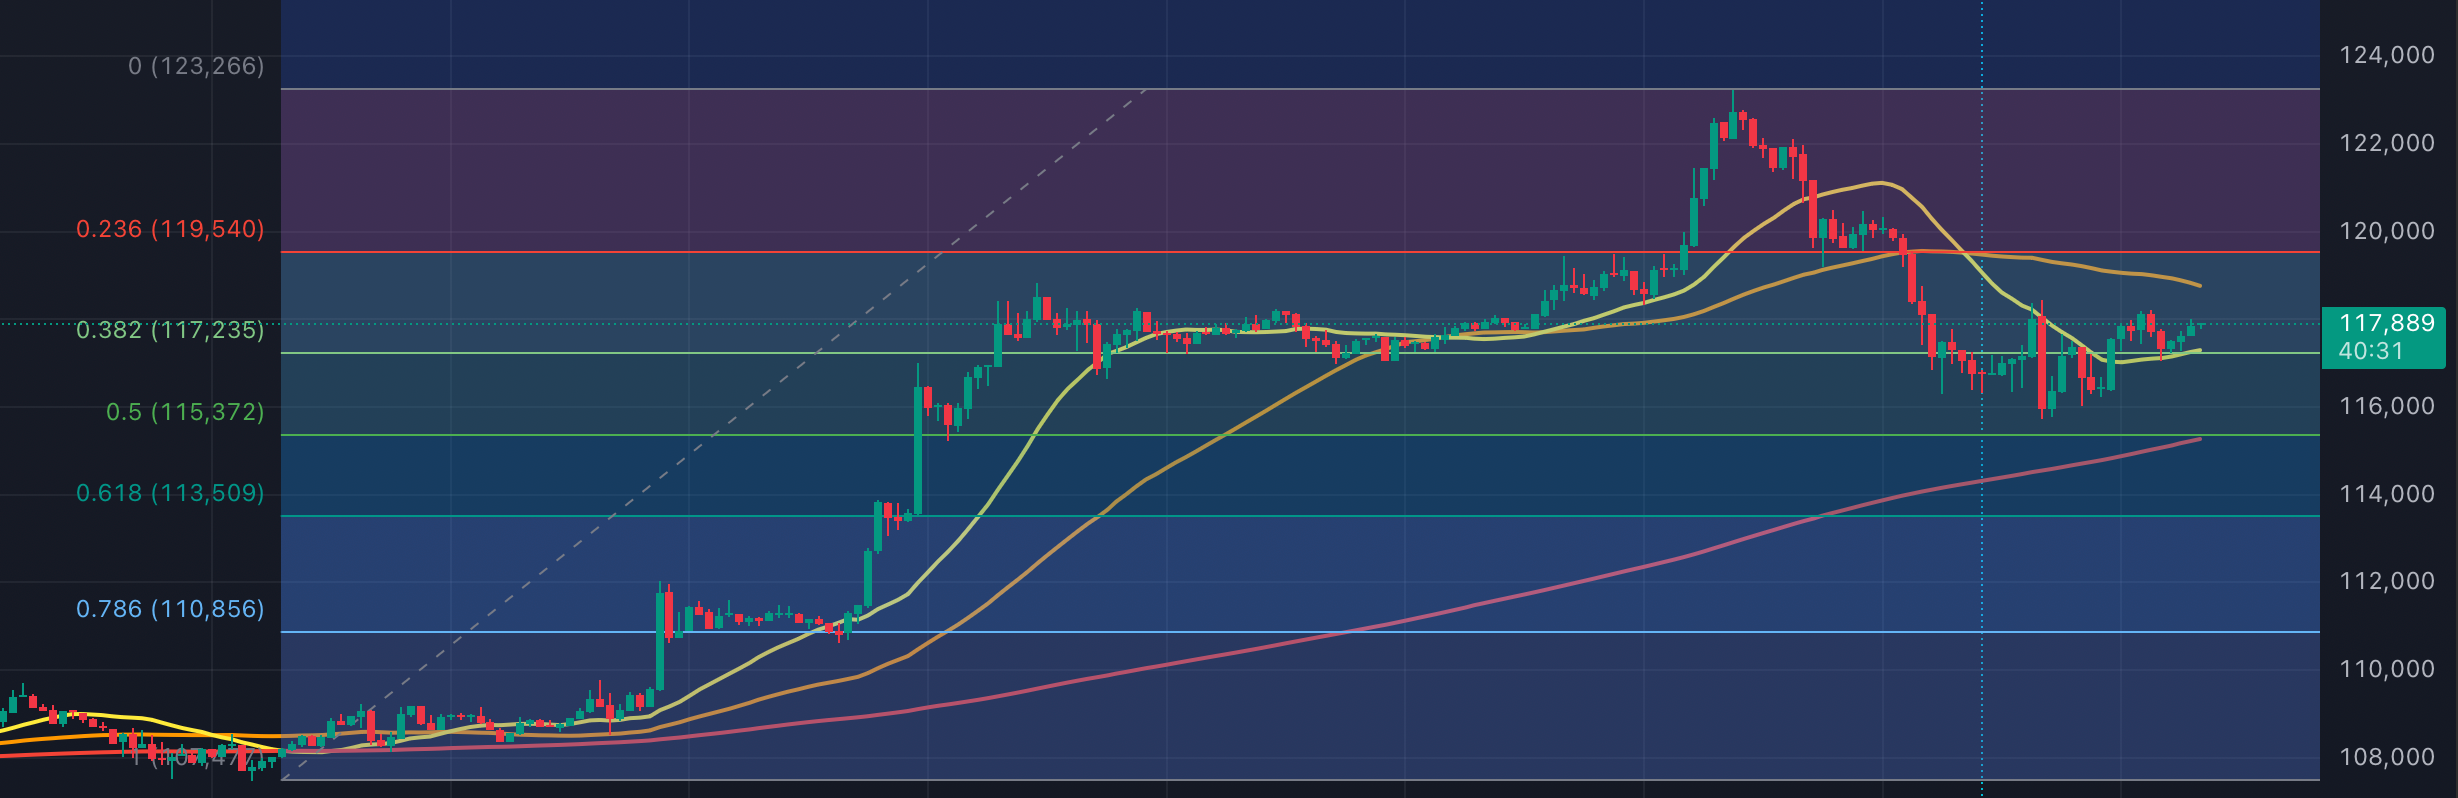
The hourly chart
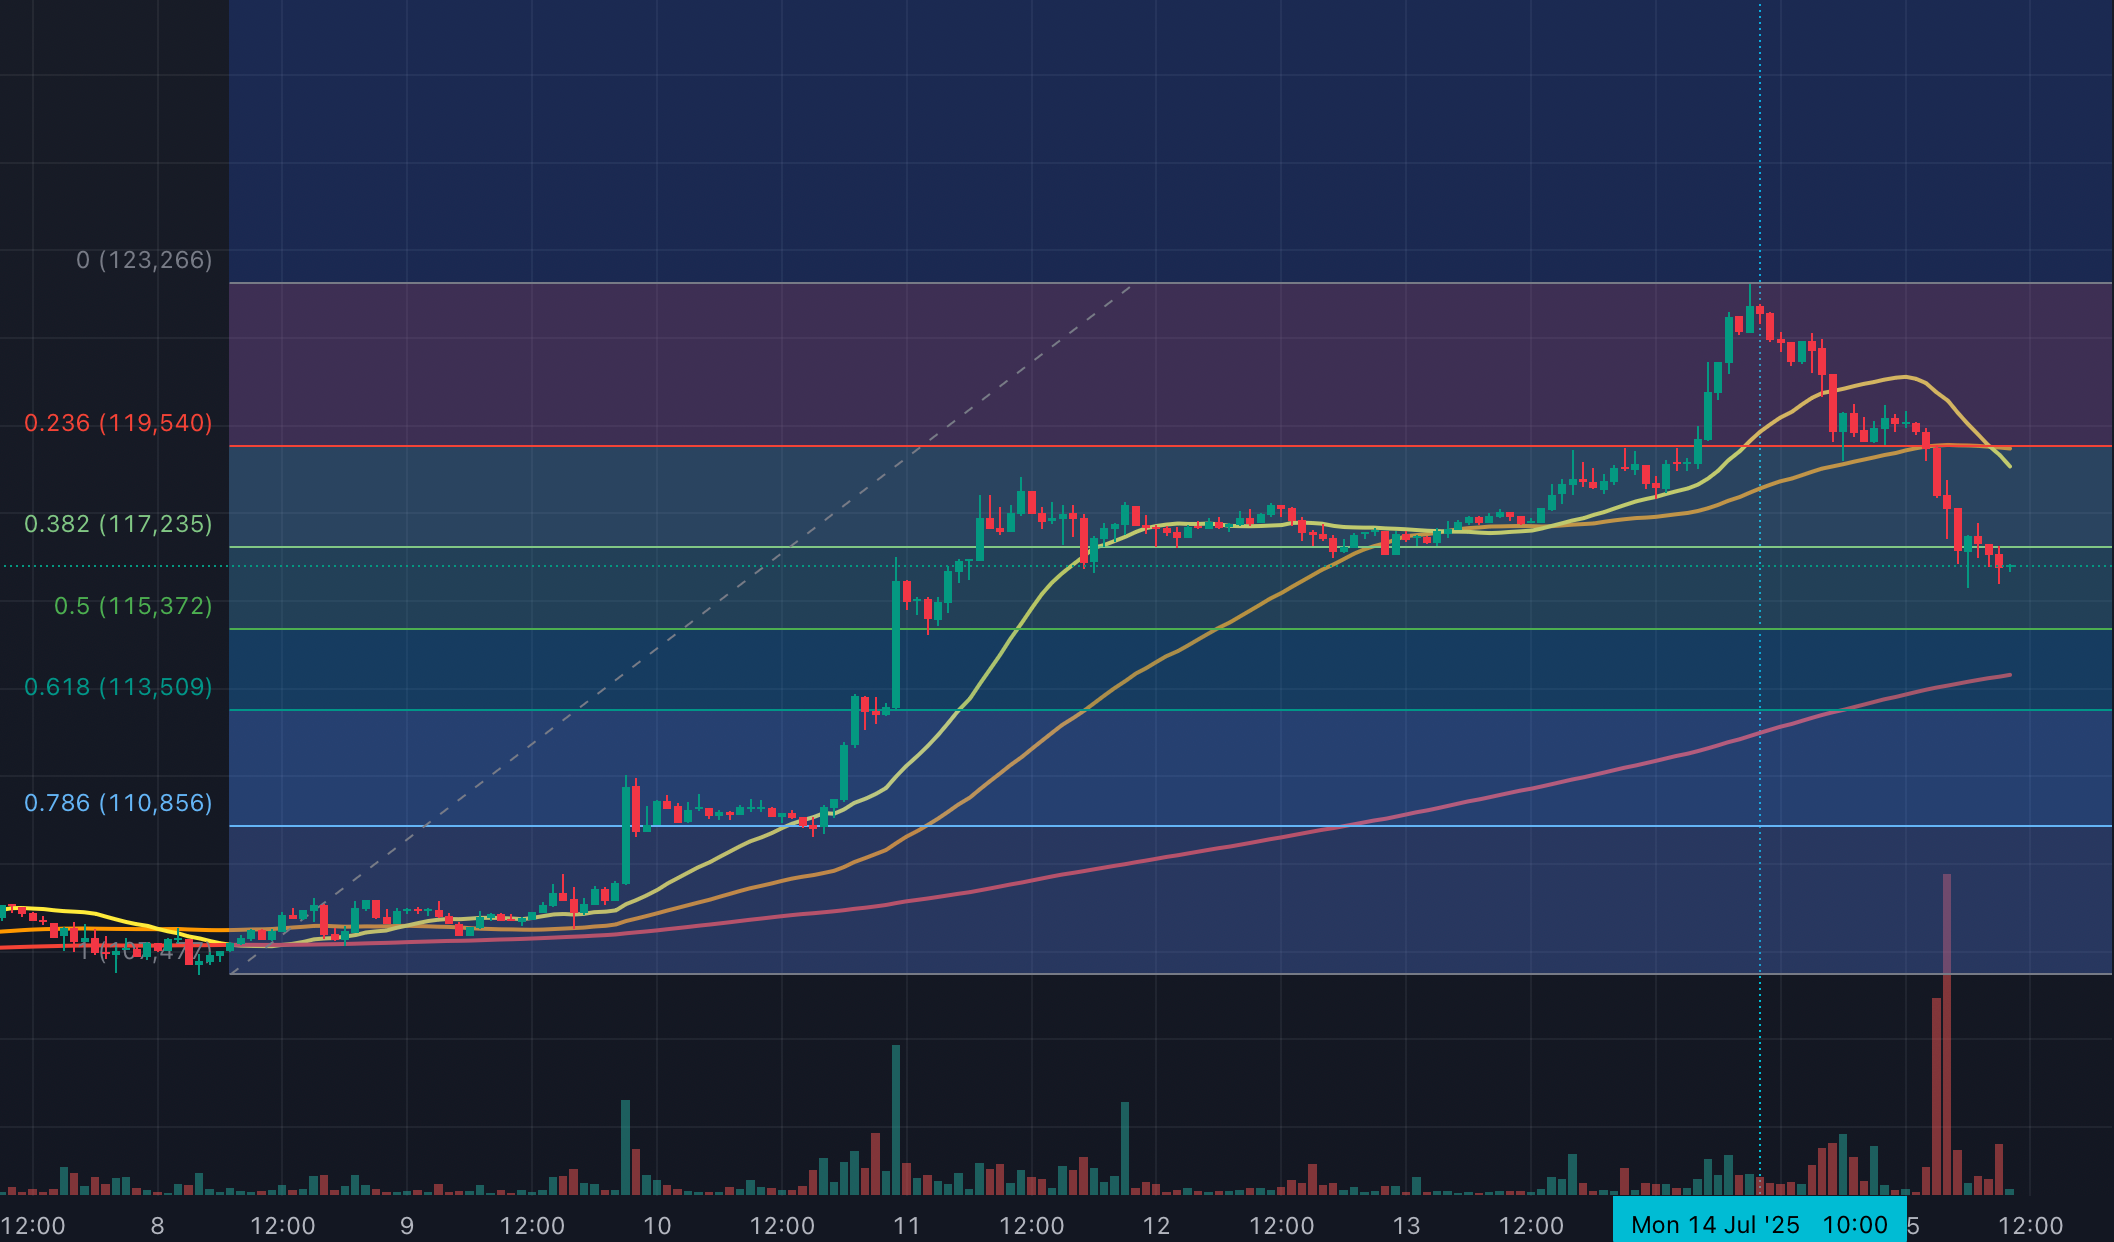
On the hourly chart, the trend has reversed to bearish (lower highs and lower lows).
But: the MA lines are intertwined and the price is below the two 'faster' MA20 and MA50 lines. This shows that the bearish trend is not yet very stable and will probably not last that long.
What about the retracements and their support?
You can clearly see that the support at $119,500 (the first retracement zone, 23.6%) held for a while. Then the price broke through the support, on its way to the next retracement zone: $117,200. That support also held for a few hours.
Technically, you could say that that support is still holding. After all, there is (as yet) no major price drop at the time of writing and the volatility has disappeared; the price is no longer moving that much. So the bottom seems to have been more or less reached.
A bottom of $116,800 that seems to be holding, decreasing volatility... Are we getting a breakout?
My expectation
As for today's Bitcoin price, it all looks pretty good according to the charts. We've seen the expected retracement and there are no real alarm signals.
Much depends on the news from the US later today:
Has inflation risen, which increases the chance of interest rate hikes? Then a (temporarily) falling Bitcoin price is more or less logical.
Are the inflation figures not so bad and does Wall Street react enthusiastically? Then nothing stands in the way of a new All-Time High!
Please note: I am NOT giving you financial advice. The only thing you read here is my expectation and not a 'prediction' or anything like that. You will never get a tip from me, not even 'between the lines', to buy or sell something.
The only and best advice I can give you is: always do your own research – preferably always in the same way – before you decide to buy or sell an 'asset' like Bitcoin.


