

These are the times when you don't want to be driven crazy by all the FUD ("Fear, Uncertainty, and Doubt") being spread around. The sudden drop in Bitcoin price last night? Unexpected, but at the same time, easy to explain. The cause: traders who had bet on a quick All-Time High seeing their leveraged trades liquidated. Nothing more than that!
The Crypto Report Card
The Crypto Report Card remains unchanged since yesterday: a 5. Most altcoins are already recovering after the dip from the day before yesterday. After all, and I repeat what I wrote yesterday: the trend for most altcoin markets is currently bullish.
The Monthly Volatility
I can be brief about monthly volatility: it is, even after the Bitcoin price 'drop,' once again unchanged. Even after this drop, the Bitcoin price is still within the existing low and high on the July monthly chart. The real movement could therefore still come: we still have seven days left in July…
On the Bitcoin monthly chart, the high is currently 17.2% higher than the low. That percentage represents the monthly volatility. The average monthly volatility is now 21.7% over the past six months. The rangecorresponding to the average monthly volatility is $101,300 - $127,800.
The Average Daily Volatility
The Bitcoin price did not break out of the $116,500 - $121,100 range yesterday, so it wasn't an 'exciting day' for Bitcoin. Today is different!
Let's start with today's expected range, based on the average daily volatility (3.2%) and yesterday's low and high ($117,201 and $119,525): $115,800 - $120,900.
I'm writing this at 10:15 AM, European Time. The Bitcoin price has already been well below the range today, with a low (at the moment) of $114,518. And that means we can expect much more movement today, making it a very interesting day, especially for Bitcoin traders who can easily make quick profits, on both the 'long' and 'short' sides.
The Daily Chart
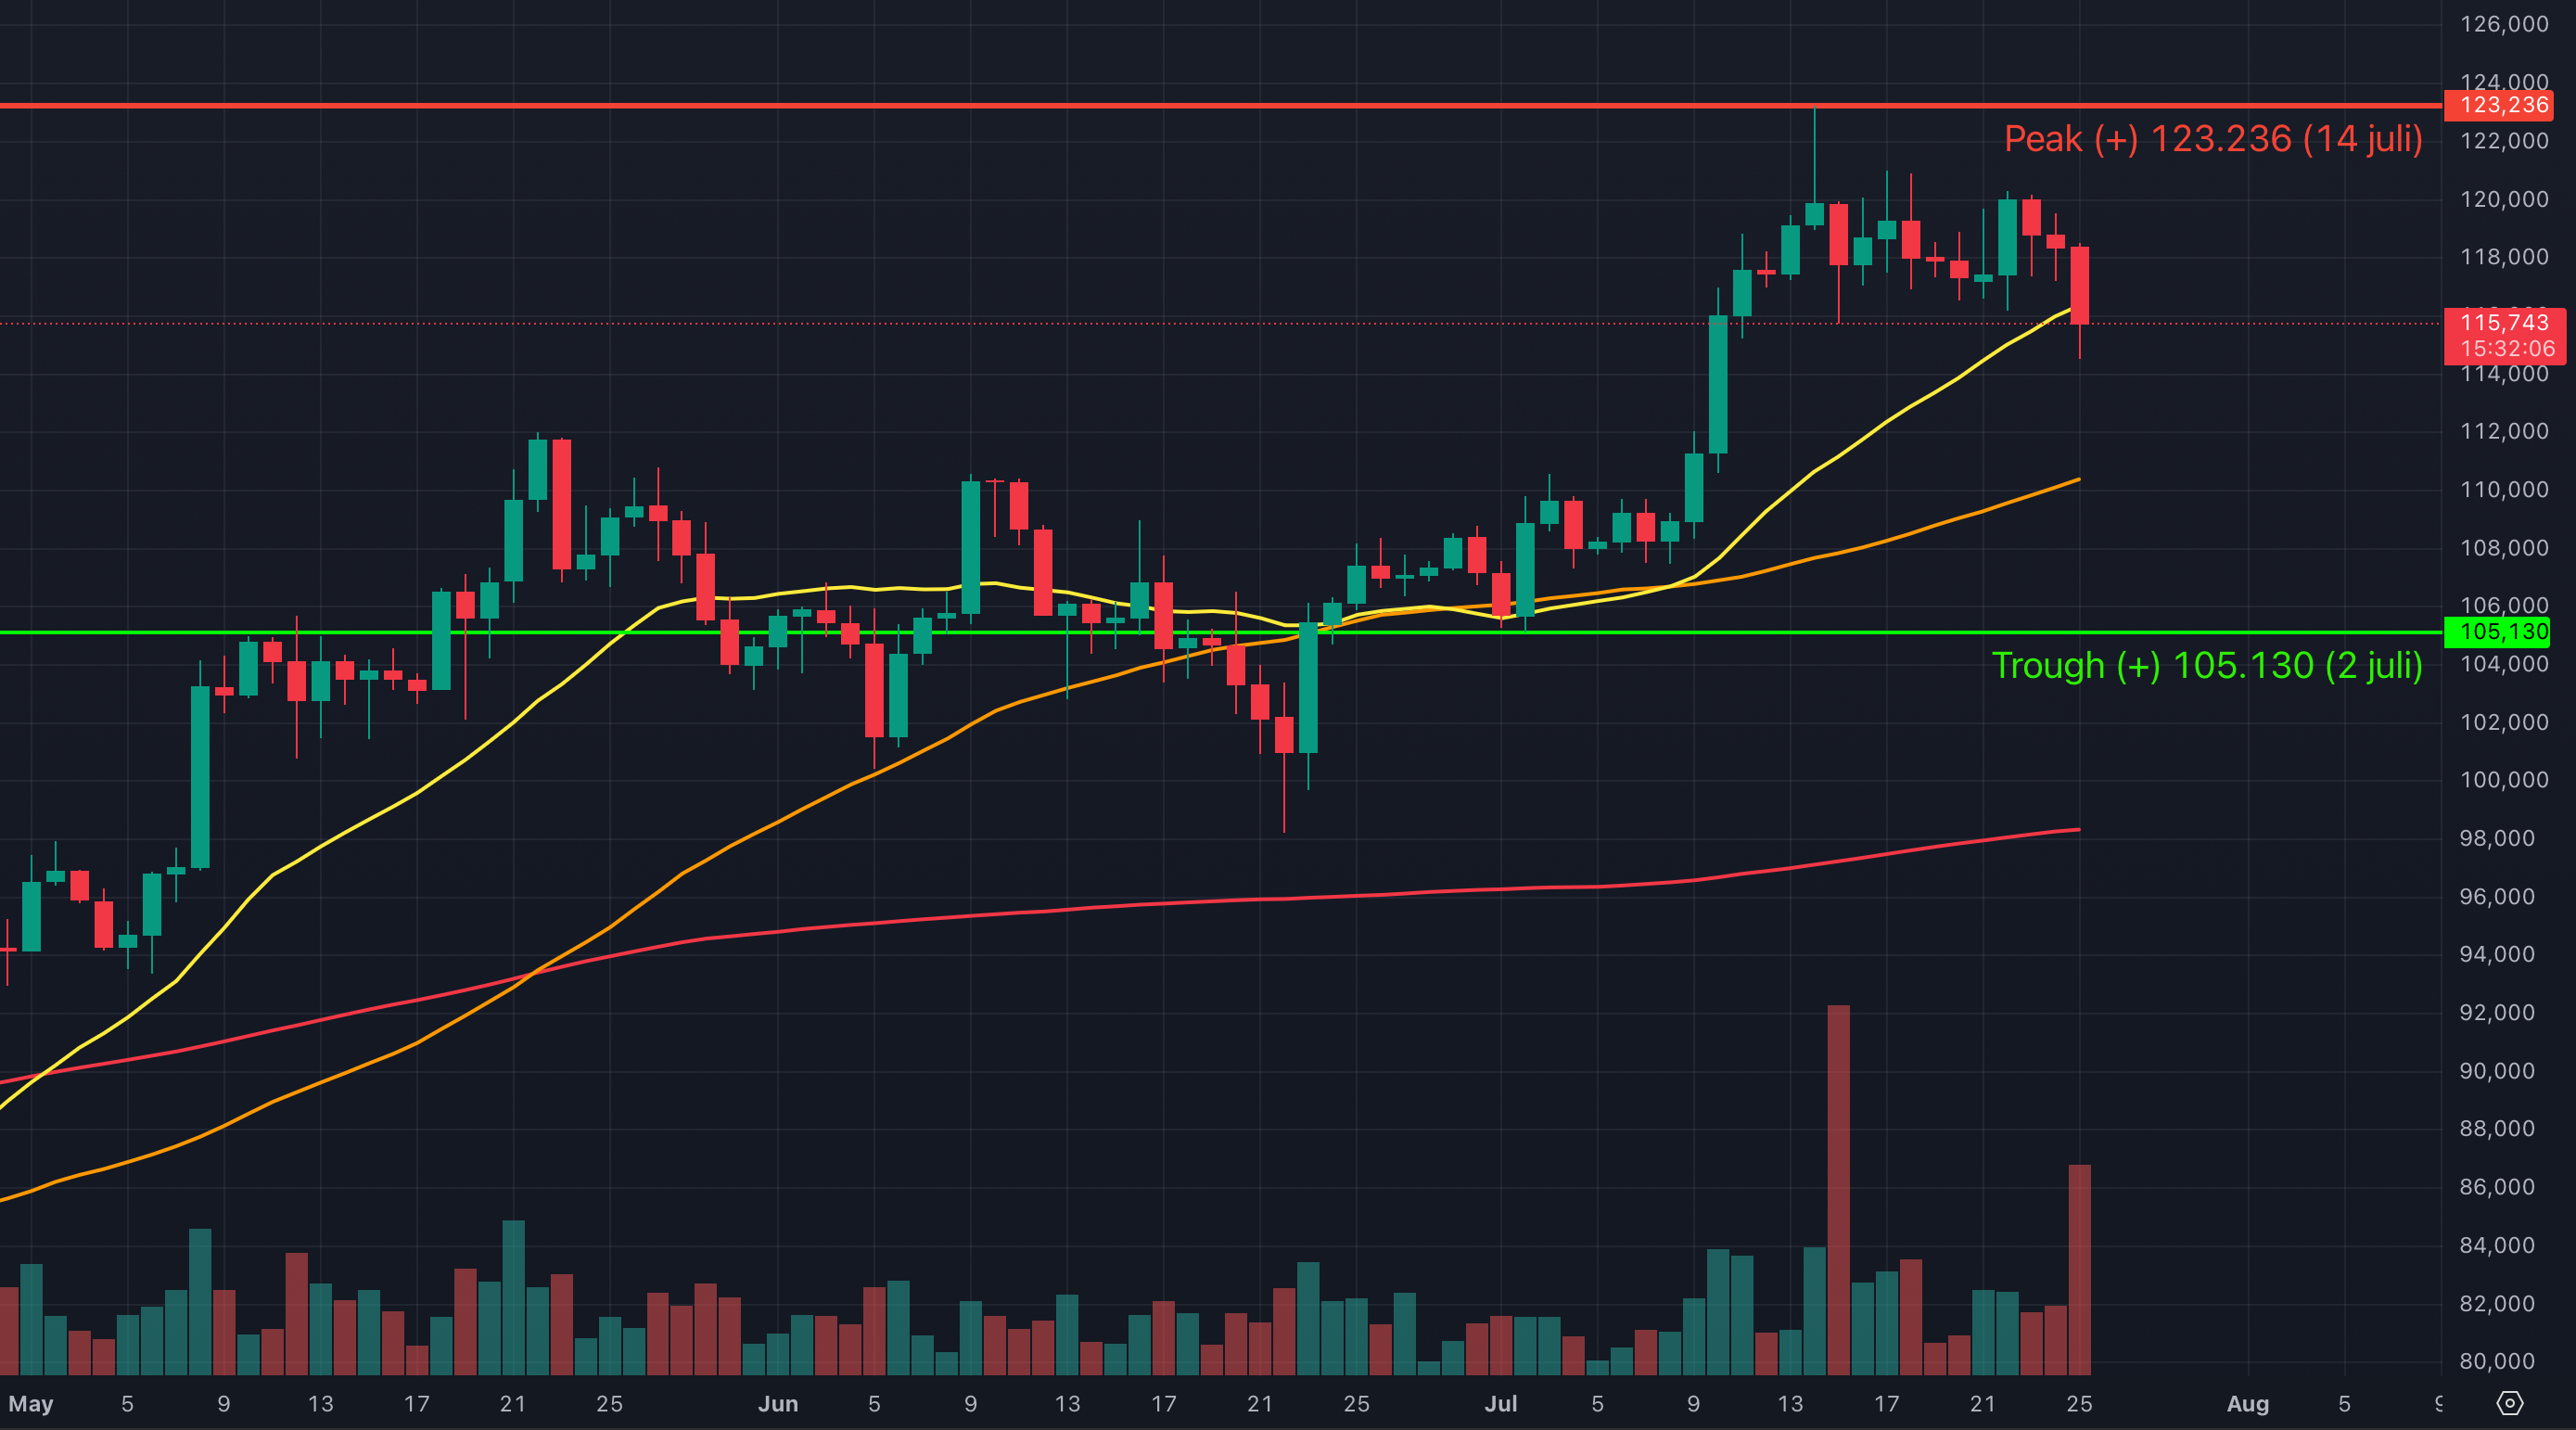
Yesterday, it seemed that with last Tuesday's (July 22) swing low, we also had a new trough. In fact, the stable bullish trend made the chance of declines below that swing low very small.
And so you see: technical analysis never offers 100% certainty. Due to a significant number of long squeezes (over 300 million dollars in four hours), where Bitcoin borrowed by traders is sold rapidly (forced), the price of Bitcoin fell by more than 2.5% in four hours. And that means the July 22 trough is now invalid. At the earliest, we will know the day after tomorrow whether the current low ($114,518) is the new swing low.
Despite the fact that the price of Bitcoin has dropped by more than 4% in the last four days, the trend on the daily chart remains stably bullish! The peaks and troughs are still higher, the MA lines are still in the correct order and still pointing upwards. In short: this price drop seems severe, but for now, it's nothing more than a temporary 'slump'.
This is also confirmed by the enthusiasm among larger investors, who are still buying Bitcoin en masse. Retail traders are charting their own course and are sometimes, like today, surprised by the devastating effect of leveraged trading. I too was surprised! I absolutely did not see last night's drop coming yesterday.
In fact: I'm still counting on an All-Time High, soon. Naïve? We'll see :)
The Hourly Chart
There's quite a lot to say about the hourly chart again.
The Falling Wedge Signal
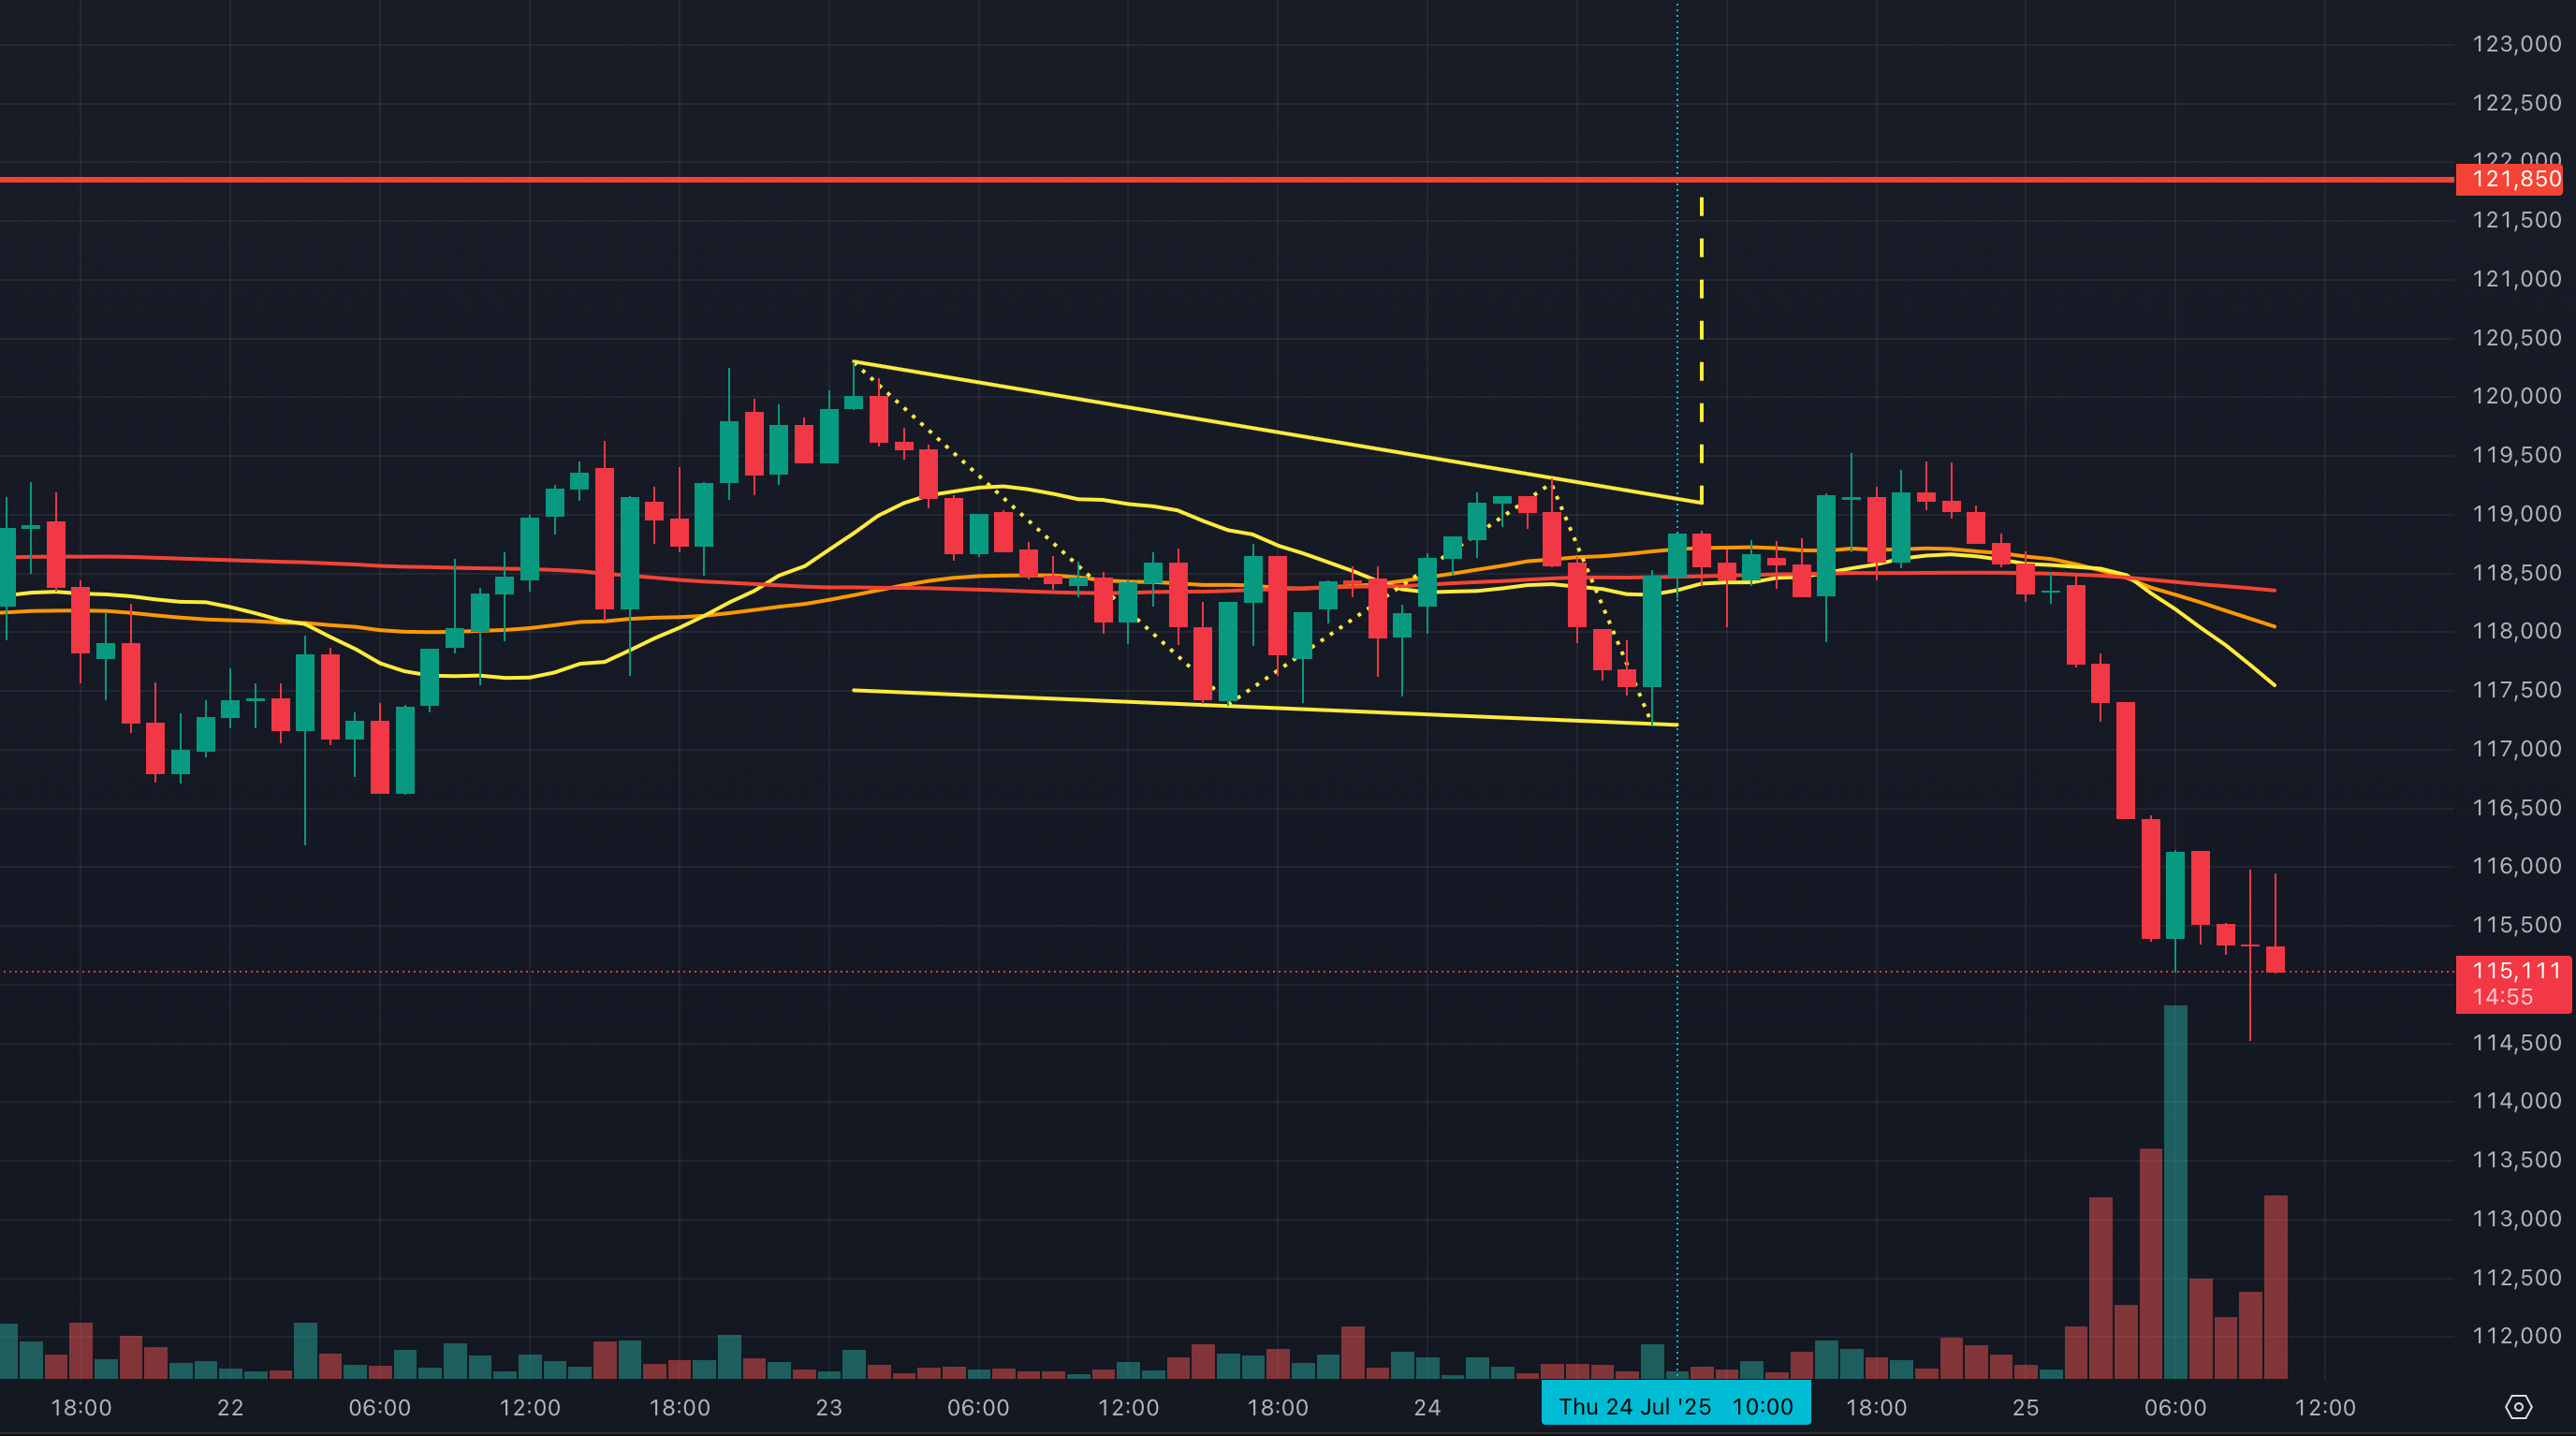
Let's start with yesterday's Falling Wedge signal. That has now become invalid.
A Falling Wedge is no longer valid if the price moves sideways instead of continuing to fall. It is also off the table when volatility causes the price to break both above and below the wedge's trend lines.
The Trend
And then the trend. It has now reversed to bearish, with lower peaks and troughs, and MA lines in the correct order for a bearish trend. But… watch out for the 'elastic' effect! The price is currently too far from the MA20. And that means the price will almost automatically be pulled back to the MA20 line; either because the MA20 line falls, or because the price rises.
Chart Patterns
Take a look at the candles from the moment the price started to fall rapidly. Momentum clearly increased, with larger bodies and hardly any wicks.
That has changed since 9 AM this morning. The wicks are now longer, with even a doji at 9 AM (no body and very long wicks).
A doji is a chart pattern that indicates uncertainty about price movement and usually precedes a reverse movement; in this case, a price increase.
The Trading Volume
Finally: the trading volume! It exploded last night, indicating that there were enough buyers present to acquire Bitcoin at a lower price.
Rising trading volume with a falling price is a divergent signal. That volume indicates increasing interest in trading Bitcoin, which doesn't fit with a falling price. The result is often that the price rises quickly.
My Expectation
For me, it's clear that the Bitcoin price drop has nothing to do with Bitcoin itself. There is no decreasing market confidence or anything like that: the price drop is purely 'technical' and a result of liquidations.
Much higher prices, and thus a new All-Time High, are still possible. But… it needs to happen quickly now. Next week, markets will undoubtedly become restless due to all the news about import tariffs. We saw what happened in the first week of April when Trump announced one tariff after another…
And so, I'm keeping a very close eye on the hourly chart.
If the price remains above the 9 AM low ($114,518) in the coming hours? Then I expect significant price increases could suddenly occur, and the trend on the hourly chart will quickly reverse to bullish.
If the price drops below $114,518? Then it might get intense for a while, but I simply see no signal that real panic will break out in the market.
Please note: I am NOT giving you financial advice. Everything you read here is my expectation and not a 'prediction' or anything of the sort. You will never get a tip from me, not even 'between the lines,' to buy or sell something.
The only and best advice I can give you is: always do your own research – preferably always in the same way – before deciding to buy or sell an 'asset' like Bitcoin.


